5.4 - Drought and ecosystem resilience
Learn how precipitation deficits develop into water-store shortages, how human use amplifies drought and why wetlands and forests differ in their capacity to survive and recover.
From rainfall deficit to hydrological drought
Drought begins with a shortage relative to expected conditions, and its effects can move through the water cycle over different timescales.
Meteorological and hydrological drought
Meteorological drought is a sustained precipitation deficit relative to a location's expected seasonal conditions. Hydrological drought is unusually low water in rivers, lakes, reservoirs or groundwater. It can develop later and persist after rainfall returns.
A dry season in a desert is not automatically drought: its rainfall may be normal for that place and time of year. Compare the same months with a stated long-term baseline, using a rainfall anomaly, percentile or other defined indicator. A short rainfall deficit first reduces interception and soil recharge. Plants continue using water and soil moisture falls. With less water reaching deeper stores, groundwater recharge declines; baseflow and reservoir inflow can fall later. Large stores buffer the initial shortage but take time to refill, so one wet week need not end hydrological drought.
Warm conditions can raise evaporative demand and intensify soil-water stress. As soils dry, actual evapotranspiration may fall even while potential demand remains high. Less rainfall can produce a proportionally much larger reduction in runoff where a basin already loses much of its input through evapotranspiration. In an original illustrative comparison, normal annual P is 500 mm and AET is 400 mm, giving 100 mm of runoff with unchanged storage. A dry year with P 450 mm and AET 390 mm gives 60 mm of runoff. Rainfall falls by 10%, while runoff falls by 40%; these are model figures, not an Australian record.
Longer-term trends change the background on which short deficits occur. A decline in a region's usual cool-season rainfall can reduce repeated opportunities to refill soil and aquifer stores. A multi-year drought can then leave a growing storage deficit. Avoid explaining every drought as a single storm failure, or treating one dry year as proof of a long-term trend. Persistence, seasonality, warming and initial storage all affect the outcome.
ENSO and persistent dry weather
Large-scale atmospheric circulation influences the likelihood of regional rainfall deficits, while individual weather systems determine their immediate timing.
The El Niño–Southern Oscillation, or ENSO, is a coupled tropical Pacific ocean–atmosphere cycle. During El Niño, central and eastern equatorial Pacific surface waters are unusually warm and the usual east–west circulation changes. Tropical convection and rainfall shift, influencing weather far beyond the Pacific. El Niño commonly raises the chance of below-average rainfall in northern and eastern Australia, especially in winter and spring. It does not guarantee drought everywhere; other climate drivers and individual weather systems can strengthen or offset its influence. La Niña often favours wetter Australian conditions, with regional and seasonal variation. Australian Bureau of Meteorology ENSO explanation.
Persistent high pressure can favour descending air. As air sinks it warms, reducing relative humidity and inhibiting cloud formation. A blocking high can redirect rain-bearing lows or fronts away from a region. However, a high-pressure symbol on one day's chart is not proof of a seasonal drought. Follow its persistence, track fronts and compare actual precipitation with the relevant baseline.
The following original illustrative synoptic field shows mean sea-level pressure in hPa over a longitude–latitude grid, with a high centred near 135°E, 32°S. It is not a Bureau forecast or a historical weather observation. A marked point near 138°E, 34°S lies close to the high. The plotted pressure values and contours are an exact model, used to practise reading the pattern.
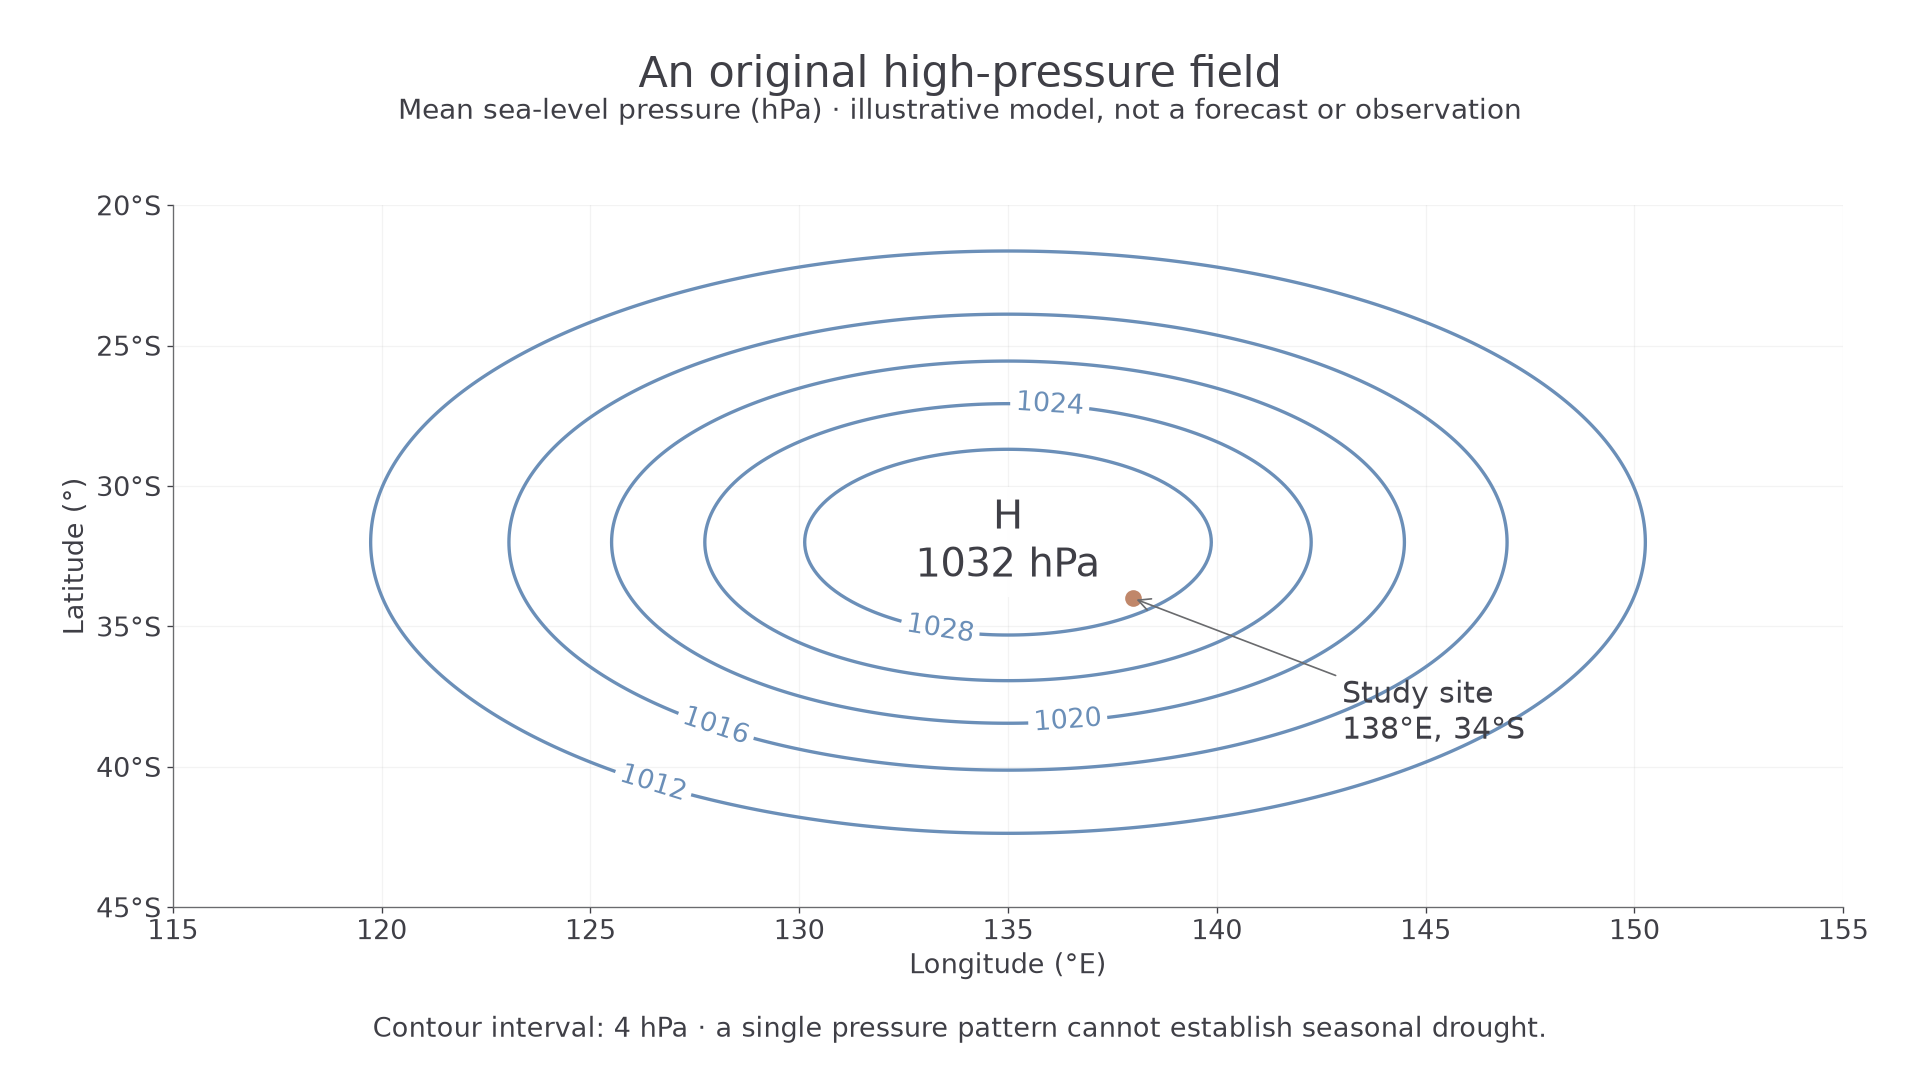
Reading an original high-pressure pattern, rather than a real forecast.
Read the units, contour interval, high's position and region of interest first. Here the site lies within high pressure, suggesting suppressed ascent and a reduced opportunity for widespread rain if the pattern persists. Wider isobar spacing indicates a weaker pressure gradient; it is not a rainfall measurement. A time sequence showing the high recurring over several weeks, together with low observed rainfall, would support a drought explanation more strongly than this single field.
The Bureau's State of the Climate 2024 identifies the Millennium Drought as 1997–2009 and reports declining cool-season rainfall in parts of southern Australia. ENSO, other circulation changes and the longer-term background must be distinguished: an El Niño phase cannot explain the full duration and spatial pattern of every multi-year event. Bureau and CSIRO, 2024.
How water use amplifies drought
People can deepen a hydrological shortage by continuing to remove water while rainfall, recharge and river inflow are falling.
Over-abstraction of surface water leaves less river flow or lake water for downstream users and ecosystems. Irrigation can turn withdrawn water into evapotranspiration, creating a net loss from the available basin flow. A reservoir buffers short deficits, but sustained releases without matching inflow draw down storage. Regulation can also reduce the frequency of flows that connect channels to floodplain wetlands. Human activity can therefore create or worsen hydrological drought without being the original cause of a rainfall deficit.
Groundwater over-abstraction occurs when pumping persistently exceeds recharge or otherwise depletes the aquifer and connected system. Falling water tables can dry shallow wells, reduce spring discharge and reduce groundwater contribution to streams. During a meteorological drought, recharge commonly falls just as demand for irrigation rises. Delayed aquifer responses can conceal the problem until substantial storage has been lost. Return flows must be counted: a gross withdrawal is not necessarily identical to net consumption.
Continue this lesson.
You’re previewing NovaLearn without an account. Create a free account to read the rest.
Create free account