6.3 - Carbon balance and planetary health
Learn how carbon stores influence the Earth's energy balance, how climate maps reveal spatial differences, and why fossil-fuel combustion affects atmosphere, ecosystems, soils and water together.
Carbon gases and the energy balance
Atmospheric carbon dioxide and methane influence how much outgoing heat is retained, rather than supplying the Sun's incoming energy.
Much incoming shortwave solar radiation passes through the atmosphere and warms the surface. The Earth emits longwave infrared radiation. Greenhouse gases absorb radiation in particular infrared wavelengths and emit radiation in all directions, including towards the surface. This natural greenhouse effect raises the surface temperature relative to an otherwise similar Earth without these absorbing gases.
Enhanced greenhouse effect
The enhanced greenhouse effect is the additional warming influence caused by increases in greenhouse-gas concentrations above their earlier background levels. It changes the Earth's radiation balance; it is not the same as the ozone hole.
CO₂ and methane are important carbon-containing greenhouse gases, although water vapour and other gases also contribute. Methane is more powerful per unit mass over a specified comparison period, but atmospheric amount, lifetime and the chosen time horizon matter. Do not rank their total influence simply by their concentration or treat one molecule as having one fixed effect for every timescale.
If greenhouse-gas concentrations rise, less energy initially escapes to space at the existing surface temperature. The climate system accumulates energy until outgoing radiation rises towards a new balance. Oceans absorb much of this energy, so the response is delayed as well as spatially uneven. This is a change in energy flow, connected to but different from a carbon mass budget.
Temperature helps control evaporation and atmospheric moisture. Warmer air can hold more water vapour at saturation, and warming can alter circulation and storm tracks. These processes influence the distribution of precipitation. They do not mean every warmer location becomes wetter: moisture supply, uplift and circulation determine where rain falls. The greenhouse effect helps set the global thermal background; latitude, altitude, ocean currents, distance from sea and circulation produce regional differences.
Reading global temperature and rainfall maps
Two maps can show related variables while revealing that a warm climate is not necessarily a wet climate.
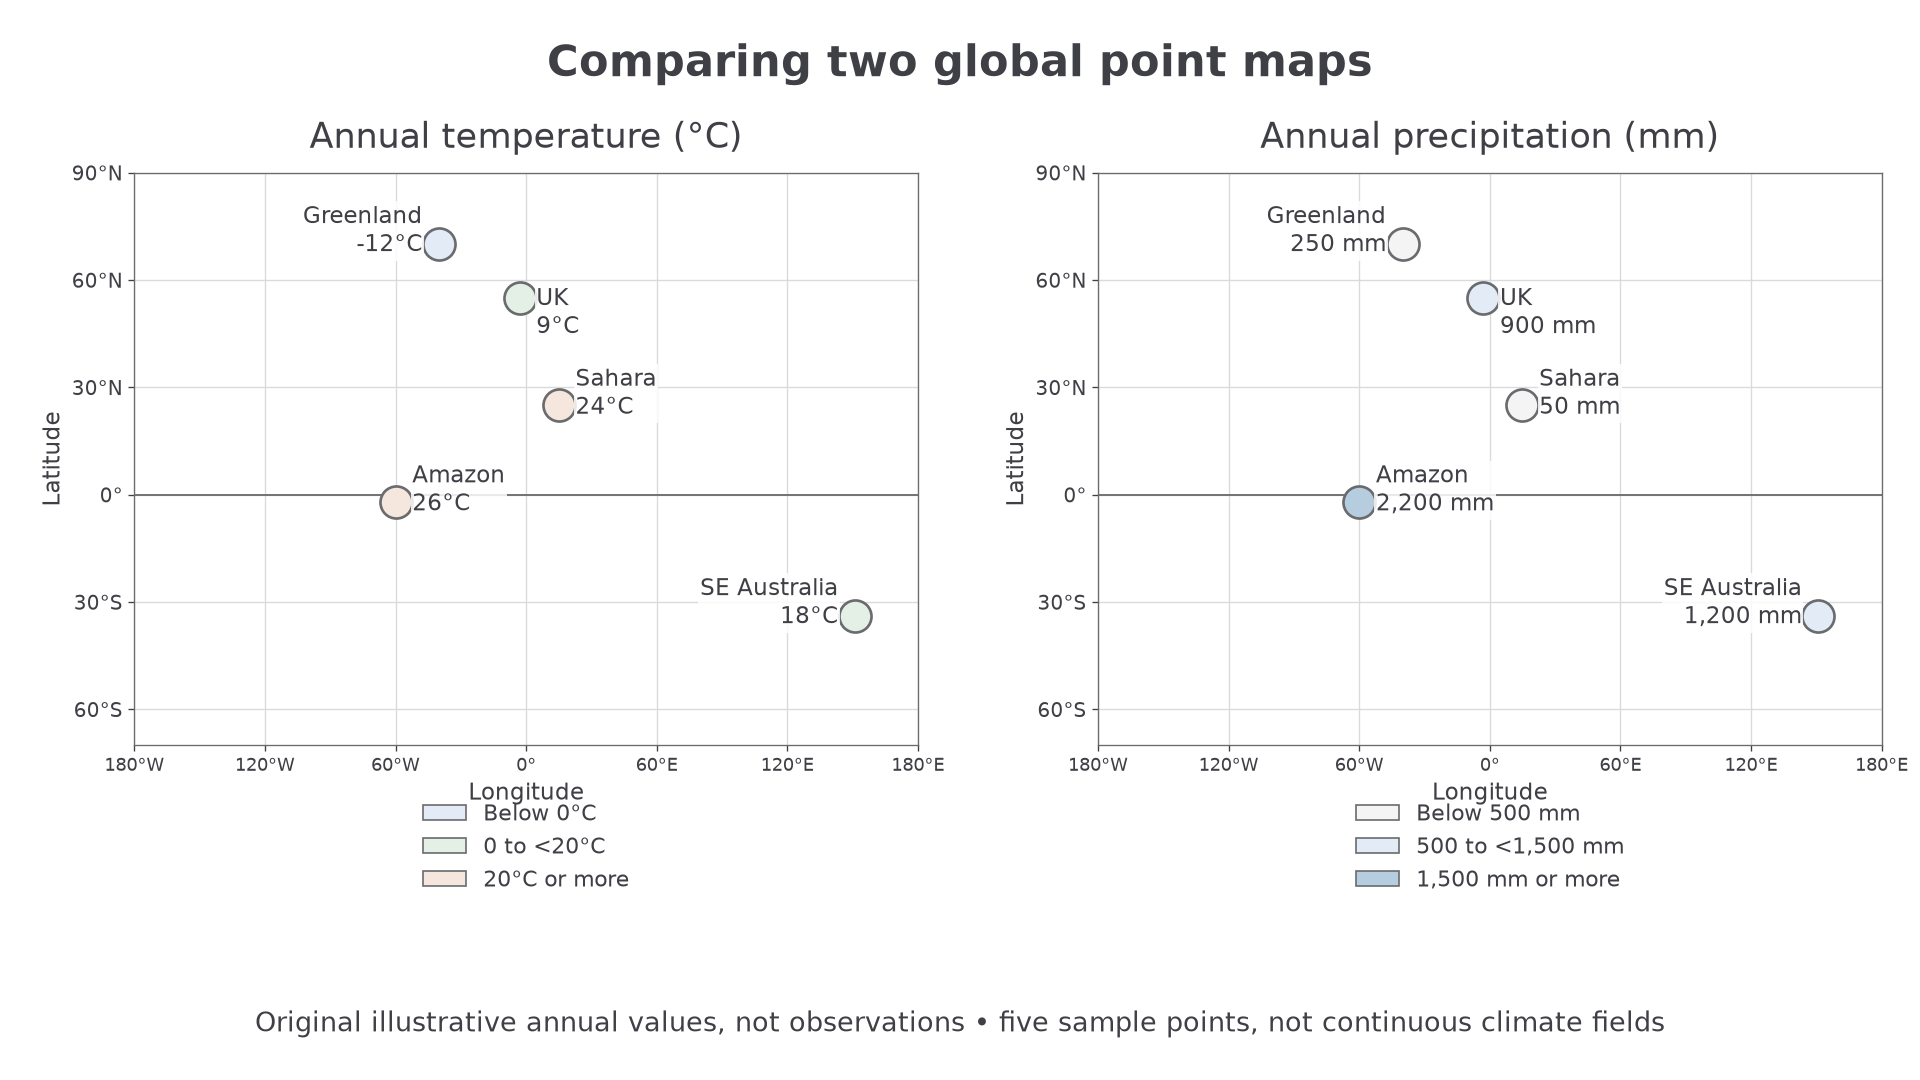
Original illustrative annual data for five sample locations, created to practise reading maps. These values are not observations or estimates for the named regions. The maps represent sample points, not continuous global climate fields.
Read the variable, unit, time period, scale and legend first. The same pale colour can mean different things in different legends; compare values rather than colours alone. On the temperature map, the equatorial Amazon sample is 26°C, the Sahara sample 24°C and the Greenland sample −12°C. On the precipitation map, those same samples have 2,200, 50 and 250 mm per year respectively. The Amazon and Sahara are both warm, but their illustrative rainfall differs by 2,150 mm per year.
This contrast makes geographical sense: rising moist air near the equator supports heavy rainfall, whereas descending subtropical air inhibits cloud formation in many desert regions. At high latitudes, lower solar input and long winter nights support colder conditions. Mountains may be cooler than lowlands at the same latitude and create wet windward/dry leeward contrasts. Ocean currents and seasonal wind shifts further interrupt simple latitude bands. These mechanisms explain why temperature and precipitation maps must be considered together.
For authentic map practice, compare the same months in NASA's land surface temperature and total rainfall resources. The first measures the daytime surface seen by the satellite, not standard air temperature; the second shows monthly rainfall, not an annual total. Their legends and measures cannot be substituted for the illustrative annual data above. Compare seasons to see movement of warm and rainy zones, and check missing-data areas before claiming an absence of rainfall or heat.
A distribution map establishes a pattern at its resolution. It does not by itself prove that greenhouse gases caused a particular local condition. A single month is weather-scale evidence; a persistent climate pattern requires longer records. Point samples miss variation between points, national means hide internal contrasts, and changing colour intervals can exaggerate visual change. A sound interpretation names a pattern, cites values or locations, explains a plausible process and states the evidence's limits.
Continue this lesson.
You’re previewing NovaLearn without an account. Create a free account to read the rest.
Create free account