8B.4 - Nation states, borders and recognition
Learn how different population histories and border histories shape states, and why practical control, legitimacy and international recognition are distinct.
States and population histories
A state is a political organisation, while a nation is a community understood to share identity; their boundaries need not coincide.
Nation state
A state whose political territory is associated with a national community. In practice, states often contain several ethnic, linguistic or cultural groups, and a nation may be spread across several states.
National identity can be civic, based on shared institutions and citizenship, or emphasise language, ancestry and culture. Neither a common language nor one majority ethnic group guarantees political unity. Minorities can share citizenship while retaining other identities, and institutions can manage diversity in different ways.
Iceland's island location, relatively small historical population and linguistic continuity contributed to an image of cultural cohesion. That is not a timeless description of an unchanged population. Statistics Iceland recorded immigrants as 18.2% of the population on 1 January 2024, using its specific definition of a foreign-born person with foreign-born parents and grandparents. Recent migration modifies the older contrast and varies between localities.
Singapore's history as a trading port and its location on regional trade routes encouraged settlement from multiple origins. Official resident categories in the 2020 census were Chinese 74.3%, Malay 13.5%, Indian 9.0% and Other 3.2%. Several languages and cultural traditions coexist within one sovereign state. Comparing the two cases explains how isolation, economic connections and migration influence diversity; it does not justify saying that all Icelanders or all Singaporeans share one culture.
Divided bars and classification
A divided bar expresses composition on a common 100% scale, but comparability depends on the population and categories used.
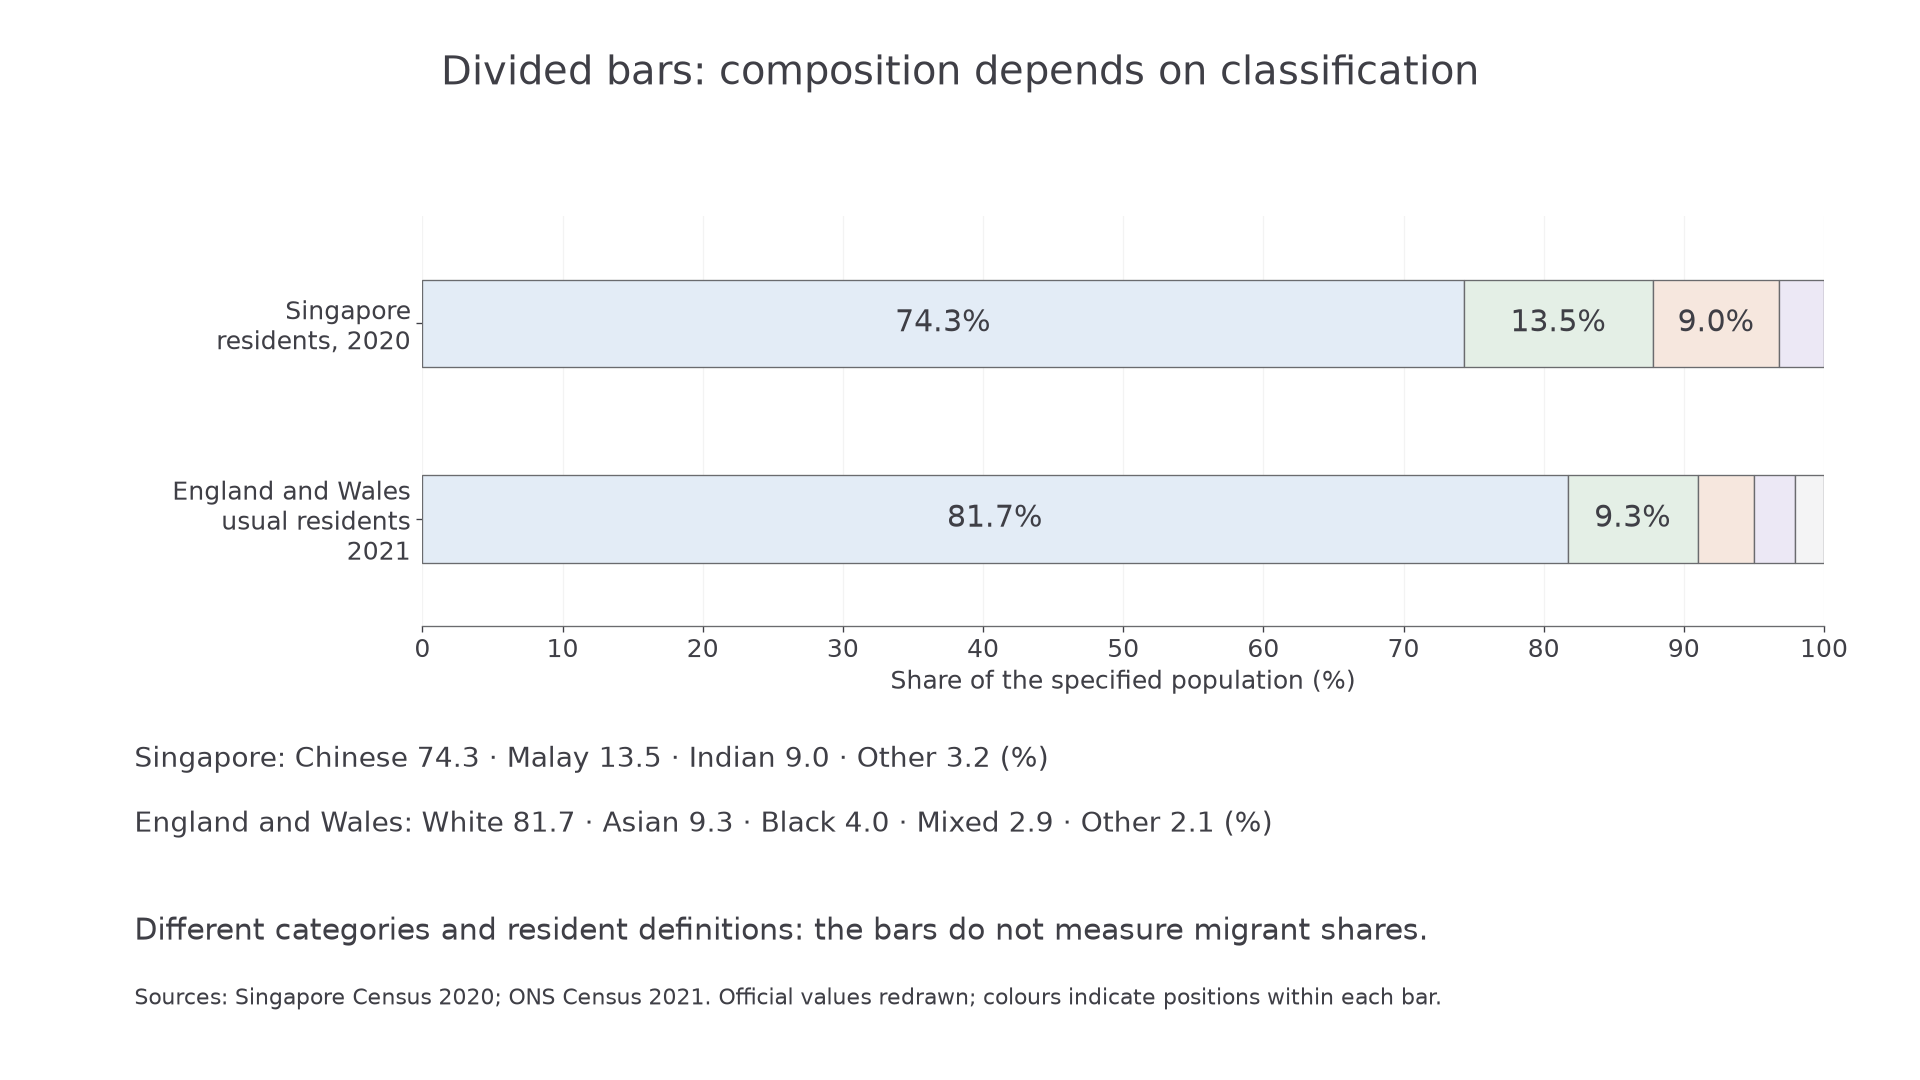
Official census percentages, redrawn. England and Wales are shown together rather than as the whole UK. Category names and resident definitions differ between the two censuses.
The Singapore bar uses the four categories above. ONS reports England and Wales in 2021 as White 81.7%, Asian 9.3%, Black 4.0%, Mixed 2.9% and Other 2.1%. Each bar totals 100%; a group occupying 13.5% takes 13.5 units along the horizontal axis. Read cumulative boundaries, not just colours: Singapore's Chinese and Malay categories together occupy 87.8%.
The largest recorded category is 81.7% in England and Wales and 74.3% in Singapore, a difference of 7.4 percentage points. This is a valid comparison of these reported category shares. It is not proof that Singapore is 7.4% “more diverse”: grouping Chinese, Malay and Indian separately but using the broad White category creates different resolutions. Neither measure is a migrant share, and the Singapore resident denominator excludes non-residents. Ethnicity also cannot be directly compared with Iceland's immigrant-origin classification.
When constructing a bar, use the same total length, calculate segment lengths from percentages, label small groups clearly and retain the data date. When comparing countries, check whether groups are mutually exclusive, how identity is recorded and who is in the denominator. A bar can describe recorded ethnic composition; it cannot alone measure integration, linguistic diversity or loyalty.
Continue this lesson.
You’re previewing NovaLearn without an account. Create a free account to read the rest.
Create free account