2A.8 - Glacial deposition and former ice flow
Learn how ice deposits sediment, how depositional landforms preserve a changing glacier margin, and how fabric, maps and drumlin measurements help reconstruct former ice movement.
Moraines and drumlins
Depositional landforms form where ice releases, pushes or reshapes debris, but their position records different parts of the glacier system.
Lateral moraines accumulate along valley-glacier margins from rockfall debris and material carried near the sides. When two glaciers join, their inner lateral debris bands combine into a medial moraine on the joined glacier. The debris may later be deposited as a ridge, although subsequent erosion can remove it.
A terminal moraine marks the furthest position reached during a particular advance. Debris accumulates or is pushed up at the snout. A recessional moraine forms at a pause or minor readvance during overall retreat. Its position can therefore record an intermediate margin. A ridge takes time and sediment supply to build; a glacier can pass through a position without leaving a visible moraine. Retreat means the margin moves back because ablation exceeds supply there, while the remaining ice generally continues to flow forwards.
Drumlins are streamlined hills, often of till and sometimes with bedrock cores. In a typical form the blunt, steeper end faces up-ice and a longer tapering end points down-ice. They commonly occur in swarms aligned with former flow. Moving ice can deform, deposit and erode sediment into streamlined shapes under suitable basal conditions. Their formation is debated and may involve different processes at different sites; do not explain every drumlin as a simple heap dropped by stationary ice. Bedrock-cored drumlins also show that erosion and deposition can operate together.
Till plains and sediment fabric
Till is deposited directly by ice and usually lacks the sorting that flowing water produces.
Till
Sediment deposited directly by glacier ice, commonly containing a poorly sorted mixture of clay, silt, sand, gravel and larger clasts.
Lodgement till forms when debris at the bed is pressed against the substrate and friction stops it while ice continues over it. It is commonly compact and can contain striated clasts. Ablation till is released as debris-rich ice melts, at or near its surface and margin; it can be looser, and melt-out material may subsequently slump or be reworked. These names describe depositional processes. Neither guarantees a unique diagnostic texture, and real deposits may contain several phases of deposition and deformation.
Low-relief till plains result where broad sheets of till mantle a landscape. They can include drumlins, minor ridges and irregular drainage rather than being perfectly level. The BGS account of Scotland's Midland Valley documents till and drumlins in several lowland areas, including the Clyde and Forth valleys. This contrasts with upland rock-dominated scoured landscapes.
The fabric of a till is the arrangement of clasts, including their long-axis orientations. Basal shearing can align elongated clasts, giving evidence of movement. Expose a consistent horizon, select elongated clasts with a stated size threshold, measure long-axis bearings and dips, and record sample size and sampling method. Avoid choosing only the most obviously aligned stones. A rose diagram displays frequency by bearing class.
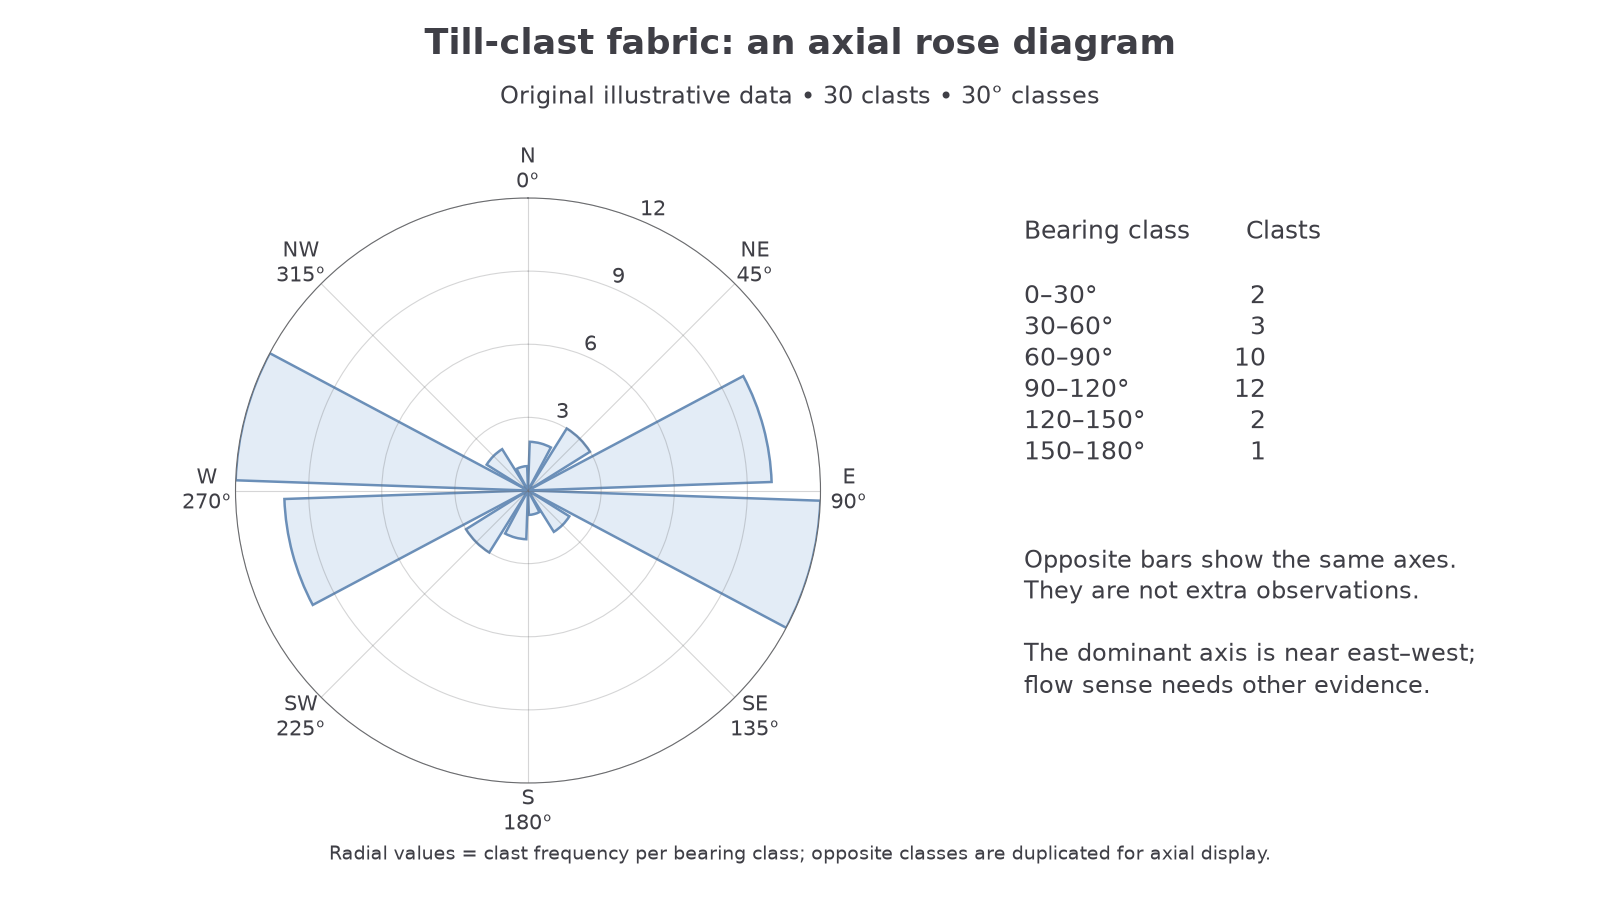
The original illustrative sample has counts 2, 3, 10, 12, 2 and 1 in the six 30° classes between 0° and 180°. Each long axis has two equivalent ends, so the plot repeats each count on the opposite side; the sample remains 30 clasts. The dominant east–west fabric suggests an axis of former shearing, not proof of eastward rather than westward movement. Slope creep, reworking and multiple ice-flow phases can distort fabric. Compare it with landforms and bedrock evidence.
Reconstructing ice extent and provenance
A reconstruction becomes more convincing when several independent forms of evidence agree in space and relative age.
An erratic has a rock type unlike the local bedrock and was transported by ice. Identify its lithology, locate plausible source outcrops on a geology map and use other flow indicators to choose a plausible route. An erratic identifies provenance only as securely as the rock identification and source match; a widespread rock type can have several possible origins.
End moraines indicate former margins; drumlin axes indicate the flow alignment and, where morphology is clear, the blunt-to-tapered direction. Crag-and-tail landforms point from the resistant crag towards the protected down-ice tail. Roches moutonnées and striations add erosional evidence. Consistent indicators can trace movement from a source area to a former margin. A single moraine is not automatically the maximum extent of all Pleistocene glaciations.
For a UK enquiry, use BGS superficial-deposit maps, historically called drift maps, to distinguish till, sand and gravel, and bedrock. The specification's “BGS” refers to the British Geological Survey. Overlay these with OS contours, mapped erratics and field observations in GIS using one coordinate system. Trace landforms rather than interpreting every sand-and-gravel polygon as a terminal moraine. Test a proposed boundary against the distribution of deposits, erosional forms, altitude and known dating where available.
Equivalent geological and topographic mapping outside the UK provides a check on whether the same interpretation works elsewhere. Include map scale, source date and confidence classes. Later glaciers can cross earlier drumlins; meltwater can remove deposits; farming and development can obscure ridges. Where indicators disagree, map alternatives instead of forcing a single arrow. BGS's Northern England account describes changes in ice flow and the importance of till provenance, illustrating why a landscape need not record only one phase.
Orientation gives a possible flow axis; asymmetry, provenance and a landform assemblage help establish direction, extent and confidence.
Drumlin morphometry and contrasting samples
Measuring drumlin shape makes a visual impression testable, but choices about sampling and boundaries influence the result.
Morphometry measures landform dimensions. On a map or digital elevation model, measure the longest plan axis as length, the maximum perpendicular width, and height relative to the surrounding surface. Record the long-axis bearing and the criteria used to identify the ends. Survey a systematic or random sample across the swarm, not only the largest accessible hills. GIS hillshade direction can conceal or exaggerate forms, so compare several views and field evidence.
Use the same units for both measurements; the ratio has no units. A drumlin 600 m long and 150 m wide has an elongation ratio of 4.
The following original illustrative sample demonstrates ranking, not actual measurements of a learner's field site:
| Drumlin | Length (m) | Width (m) | Height (m) | Elongation ratio |
|---|---|---|---|---|
| A | 200 | 100 | 8 | 2.0 |
| B | 250 | 100 | 10 | 2.5 |
| C | 300 | 100 | 9 | 3.0 |
| D | 350 | 100 | 12 | 3.5 |
| E | 400 | 100 | 11 | 4.0 |
| F | 450 | 100 | 14 | 4.5 |
| G | 500 | 100 | 13 | 5.0 |
| H | 550 | 100 | 16 | 5.5 |
| I | 600 | 100 | 15 | 6.0 |
| J | 650 | 100 | 18 | 6.5 |
Length ranks are 1–10; height ranks are 1, 3, 2, 5, 4, 7, 6, 9, 8, 10. Thus and Spearman's . Height and length have a strong positive association. Against a supplied two-tailed 5% critical value of 0.648 for ten independent pairs, reject no monotonic association. Because width was held constant in this teaching example, elongation and length have identical ranks: the same height–elongation result is not independent evidence. Real surveys need variable widths and average ranks where values tie.
Compare two contrasting locations using equivalent definitions and sample sizes. Treat the ten heights in the table as an illustrative UK upland-margin sample: their mean is 12.6 m, median 12.5 m and range 10 m. A separate illustrative Canadian lowland sample has heights 5, 7, 9, 11, 12, 14, 16, 18, 20 and 28 m: its mean is 14 m, median 13 m and range 23 m. The mean differs by 1.4 m but the medians differ by only 0.5 m, partly because the Canadian sample includes a tall 28 m feature. Its greater spread and the overlap mean the result does not establish that every Canadian drumlin is taller.
Also compare mean elongation and spread, then the height–length and height–elongation correlations. A higher mean elongation does not identify one formation mechanism. Differences might reflect ice conditions, bedrock, sediment supply or mapping resolution. Statistical significance requires a suitable test and its assumptions, not just different means; the sediment lesson develops an independent-samples t-test. These datasets demonstrate a comparison to apply to real observations, not measurements of actual UK or Canadian drumlins or claims that those hypothetical surveys occurred.