Appendix 1 2(d)(ii) - Correlation and Spearman's rank
Learn to investigate whether two geographical variables change together, calculate Spearman's rank correlation and interpret its significance. A correlation describes association; explaining a process requires further evidence.
Reading scatter patterns
Plotting paired observations first helps you see whether a correlation coefficient will describe the geographical pattern sensibly.
Each point on a scatter plot represents both measurements from the same unit, such as river depth and distance downstream at one site. Put the proposed explanatory variable on the horizontal axis and the response on the vertical axis, label units and retain unusual observations. These labels express an enquiry, not proof that the horizontal variable causes the vertical one.
A positive association means larger values of one variable tend to occur with larger values of the other; a negative association means they tend to occur with smaller values. Strength concerns how consistently the points follow the pattern. A monotonic relationship continues broadly in one direction and need not be a straight line. Spearman's method measures this ordered association. A U-shaped relationship may be strong in another sense but have rank correlation close to zero because its direction reverses.
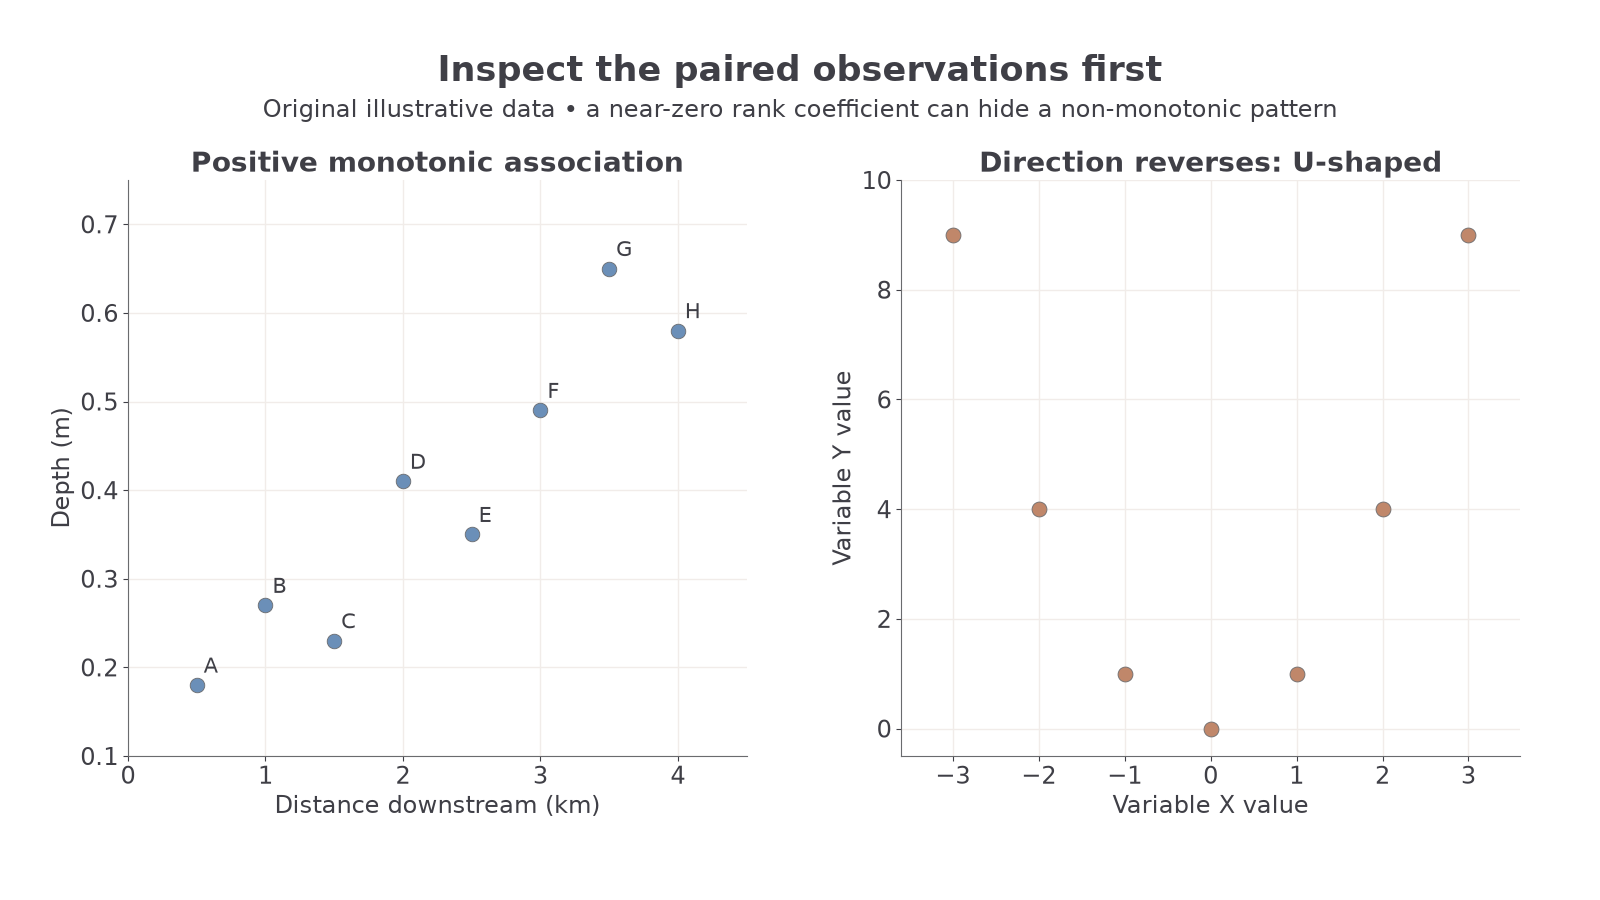
Original illustrative data. The left-hand observations are used in the ranking example; the right-hand pattern shows why a near-zero rank coefficient need not mean no relationship.
For a roughly linear cloud, a line of best fit summarises the trend through its centre. With an ordinary least-squares line, vertical squared deviations are minimised. A hand-drawn trend should reflect the whole cloud, with observations on both sides; do not join every point or force the line through (0, 0). The intercept has meaning only if zero lies in a sensible context. Interpolating within the observed range is usually more defensible than extrapolating far beyond it, where processes or constraints may change.
No best-fit line converts an observed association into a causal experiment. A relationship between event magnitude and losses, for example, may also reflect exposure, building standards and reporting. A broad pattern may contain separate regional clusters; the plotted observations help reveal them.
Calculating Spearman's rank
Ranking preserves the order of observations while reducing the influence of the distances between their raw values.
Use observations that can be ordered meaningfully, with paired values from the same units. The following original illustrative river sites represent eight separate locations measured with one consistent depth method. The data are for learning the calculation; they do not establish how an actual river behaves.
Rank distance and depth separately, giving 1 to the smallest value in each variable. Ranking largest first also works if used consistently for both variables. Keep each site's pair in the same row. Subtract the two ranks to obtain d, square each difference and add the squares. The square means a negative rank difference contributes positively.
| Site | Distance downstream (km) | Depth (m) | Distance rank | Depth rank | d | |
|---|---|---|---|---|---|---|
| A | 0.5 | 0.18 | 1 | 1 | 0 | 0 |
| B | 1.0 | 0.27 | 2 | 3 | −1 | 1 |
| C | 1.5 | 0.23 | 3 | 2 | 1 | 1 |
| D | 2.0 | 0.41 | 4 | 5 | −1 | 1 |
| E | 2.5 | 0.35 | 5 | 4 | 1 | 1 |
| F | 3.0 | 0.49 | 6 | 6 | 0 | 0 |
| G | 3.5 | 0.65 | 7 | 8 | −1 | 1 |
| H | 4.0 | 0.58 | 8 | 7 | 1 | 1 |
For paired observations without tied ranks:
Here is the number of pairs, not the combined number of measurements, and d is the difference between the two ranks for one pair. The coefficient has no unit and lies between −1 and +1.
The eight rows give , so:
This is a strong positive ordered association in the sample. A value of +1 indicates exactly matching rank orders; −1 indicates exactly reversed orders. Strength labels such as “strong” are descriptive conventions, so give the actual coefficient and direction rather than relying on the label alone. Keep unrounded working for a later critical-value comparison.
Continue this lesson.
You’re previewing NovaLearn without an account. Create a free account to read the rest.
Create free account