4B.10 - Measuring the management of diversity
Learn how to judge economic improvement, inequality and cultural integration using comparable measures, and why a change in an indicator does not on its own prove that a strategy succeeded.
Absolute, relative and comparator change
A management assessment needs a baseline, a later observation and an appropriate comparison, rather than an isolated favourable statistic.
Absolute change is the difference in the measured units. Relative change expresses that difference as a proportion of the starting value. If a percentage rate changes, subtraction gives percentage points, not percentage change.
Consider this original illustrative income comparison. These are median annual resident incomes expressed in constant baseline-year prices, so inflation has been removed.
| Area | Baseline | Five years later | Absolute change | Relative change |
|---|---|---|---|---|
| Target neighbourhood | £20,000 | £24,000 | +£4,000 | +20% |
| Similar comparison area | £25,000 | £30,000 | +£5,000 | +20% |
The target improved in absolute and relative terms, but the cash gap widened from £5,000 to £6,000 while its income remained 80% of the comparison area’s. “Incomes rose” and “the relative gap persisted” are both supported conclusions. If new higher-income residents replaced earlier low-income residents, the median might rise without improving earlier residents’ lives. Follow resident cohorts or use housing/tenure evidence as well as area averages.
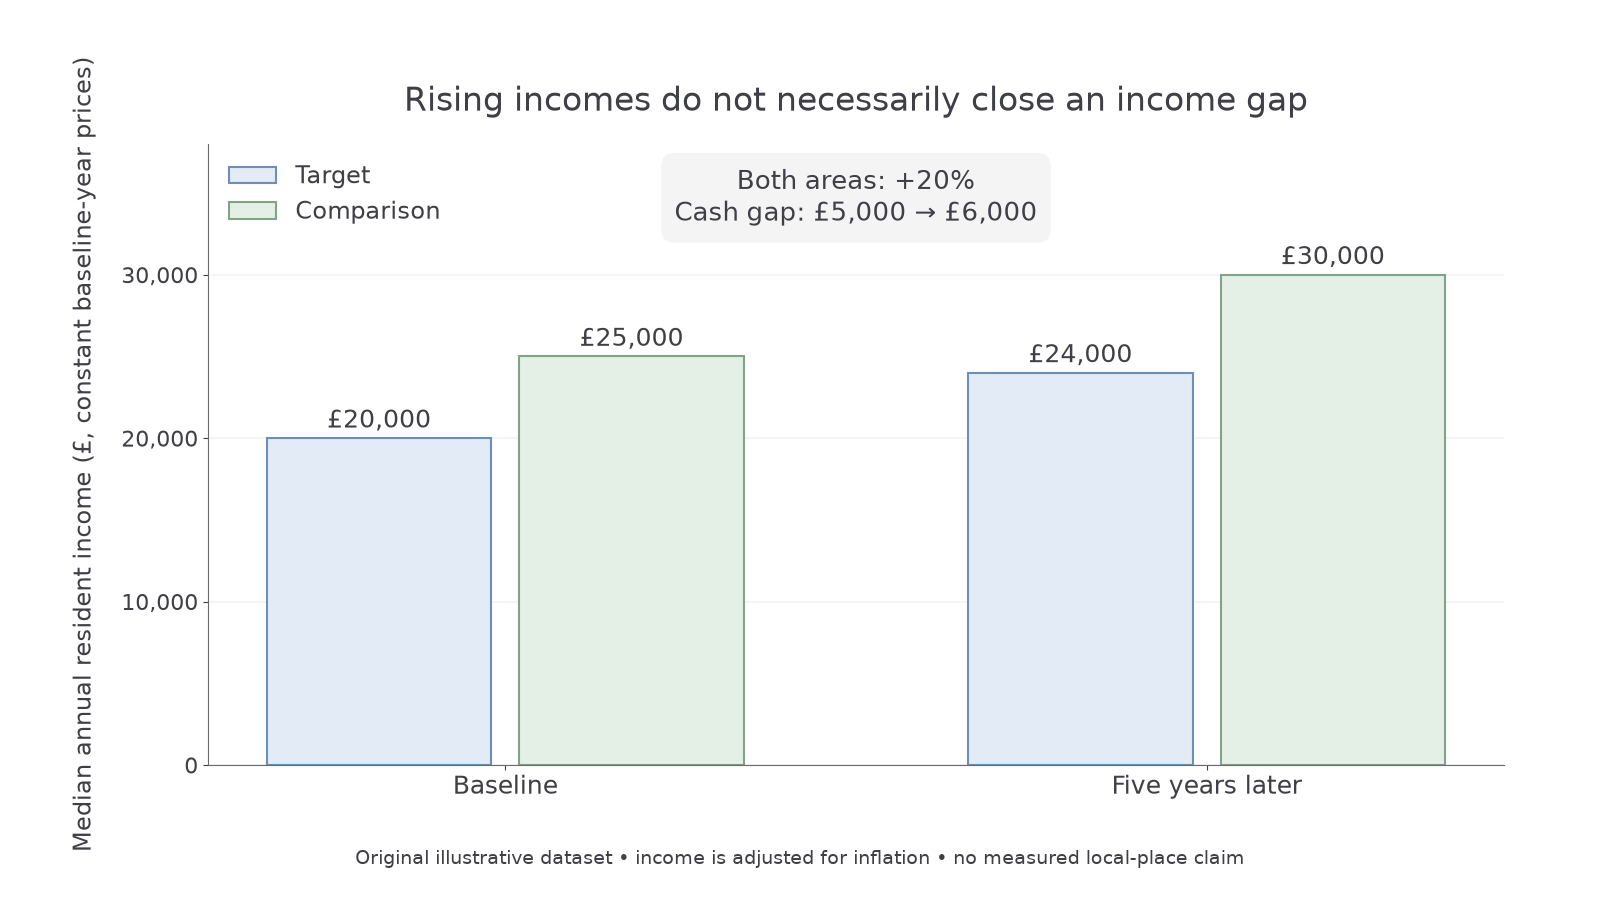
Original illustrative dataset; bars start at zero and use constant-price annual income. The comparison is not measured Stratford or Amble data.
Employment needs equally careful definitions: resident employment rate differs from jobs located in the area, and unemployment differs from economic inactivity. If an employment rate rises from 60% to 66%, that is 6 percentage points and a 10% relative increase. New jobs may be filled by commuters; growth in insecure seasonal work may not raise income security. Compare like age ranges, definitions, periods and boundaries. A comparison area helps separate local change from a wider trend but is not a perfect counterfactual if it had different starting conditions or also received investment.
Social progress and inequality
Social progress includes narrowing unfair differences within a place as well as improving its overall average.
Measure life expectancy, avoidable illness, educational opportunity, housing conditions, service access and deprivation. Examine between-area inequality, such as the gap between two wards, and within-area inequality, such as different outcomes by income, tenure, age or ethnic group. Use sufficiently large, anonymized data and avoid drawing firm conclusions from tiny subgroups.
Continue this lesson.
You’re previewing NovaLearn without an account. Create a free account to read the rest.
Create free account