6.9 - Carbon feedback, adaptation and mitigation
Learn why climate futures depend on emissions, sinks and feedbacks, how to analyse a CO₂ time series, and how players at different scales can reduce climate risks and address their causes.
Why climate futures are conditional
Future warming is uncertain in magnitude and regional detail, but uncertainty does not erase the established link between greenhouse-gas emissions and warming.
Human emissions depend on population, economic growth, energy demand, technology, land use and policy. More people or higher output can raise demand, but neither determines emissions alone: efficiency, consumption patterns and the energy mix change emissions per person and per unit of output. A scenario is a stated set of assumptions about such drivers; a projection is the modelled outcome conditional on those assumptions. It is not a prediction that society will inevitably follow that pathway.
The carbon balance matters as well. Land and oceans remove some emitted CO₂, but the strength of these sinks varies with vegetation, nutrients, temperature, drought, fire and ocean circulation. Faster plant growth under more CO₂ can increase uptake under suitable conditions; water and nutrient limits prevent an unlimited fertilisation effect. Warmer water holds less dissolved CO₂ at equilibrium, while stratification and circulation influence transfer to depth. We must distinguish an uncertain future sink response from a claim that sinks stop functioning everywhere.
A simplified annual atmospheric carbon balance is:
All terms must use the same carbon units and time interval, and the boundaries must avoid counting a land release both as an additional emission and as a reduced net land sink. This is a conceptual bookkeeping equation, not a complete climate model.
For an original illustrative budget, human emissions of 10 and additional releases of 1, with land uptake of 3 and ocean uptake of 2, give an atmospheric increase of 6 gigatonnes of carbon per year. If net land uptake falls to 1 while the other entries stay fixed, the increase becomes 8. Identical human emissions can therefore produce different atmospheric accumulation. Gigatonnes of carbon and gigatonnes of CO₂ are different units: CO₂ mass is times carbon mass because the molecule also contains oxygen.
Natural variability, model structure and future human choices contribute different uncertainties. Internal climate variability can obscure short trends; uncertainty about future emissions becomes particularly important over longer periods. The IPCC AR6 synthesis (2023) evaluates multiple pathways rather than assigning one certain 2100 outcome. Its physical assessment identifies human influence as the cause of contemporary warming; uncertainty about future feedback size is not equal evidence for every explanation of observed change.
Carbon feedbacks and tipping risks
A positive feedback reinforces an initial change; a tipping point concerns a threshold beyond which change can become self-sustaining or difficult to reverse.
Warming can thaw permafrost, ground that has remained frozen for at least two consecutive years. Thaw exposes previously protected organic matter to decomposition. Oxygen-rich conditions favour CO₂ release, while waterlogged oxygen-poor conditions can produce methane. Both can increase greenhouse forcing and further warming. The amounts and timing depend on thaw depth, soil moisture, microbes and vegetation; thaw does not mean all stored carbon is instantly released.
Peatlands store partly decomposed plant material because wet conditions slow decay. Drying, drainage or warming can expose peat to oxidation and fire. Carbon accumulated over centuries or millennia can then be released much faster than it is replaced, reinforcing warming. Rewetting can reduce oxidation but may raise methane in some conditions, so greenhouse-gas balance and timescale matter. Peatland release is not identical to permafrost release: peat need not be frozen, and frozen ground need not consist of peat.
Forest dieback can reduce photosynthesis and release carbon through decomposition or burning. Reduced evapotranspiration and moisture recycling can reinforce drying in some regions. The IPCC AR6 carbon-cycle chapter (2021) assesses these processes and their uncertainties. A possible threshold is not a date known in advance; regional forests can differ in exposure, resilience and response, and a local drought is not proof of irreversible basin-wide dieback.
The Atlantic Meridional Overturning Circulation (AMOC) transports warm water northwards near the surface and returns deeper water southwards. Cooling and salinity influence density and sinking in the North Atlantic; freshwater input and surface warming can reduce density and alter overturning. This can redistribute heat and rainfall and affect ocean carbon uptake. AMOC is a physical circulation system with carbon consequences, not itself a store that simply releases carbon when it stops. It is also more complex than a single surface “Gulf Stream conveyor belt”.
The IPCC AR6 ocean assessment, chapter 9 (2021) assessed AMOC weakening this century as very likely, with medium confidence that an abrupt collapse would not occur before 2100. This dated assessment expresses both a strongly supported direction and uncertainty over a severe threshold outcome; it is not a guarantee against collapse or a forecast of imminent collapse. Potentially severe, hard-to-reverse outcomes justify risk planning without inventing a precise trigger.
CO₂ graphs, means and rates of change
A time series shows changes in concentration; its slope is a rate of atmospheric accumulation, not directly a measure of total emissions.
The table gives authentic annual mean CO₂ mole fractions for NOAA's Mauna Loa series, retrieved on 2 October 2026 from a file created on 5 September 2026. The annual values can be revised after quality control. Measurements were temporarily taken at nearby Maunakea during the Mauna Loa interruption from late 2022 into 2023, as explained in the NOAA data and methods.
| Year | Annual mean CO₂ (ppm) |
|---|---|
| 2019 | 411.65 |
| 2020 | 414.21 |
| 2021 | 416.41 |
| 2022 | 418.53 |
| 2023 | 421.08 |
| 2024 | 424.61 |
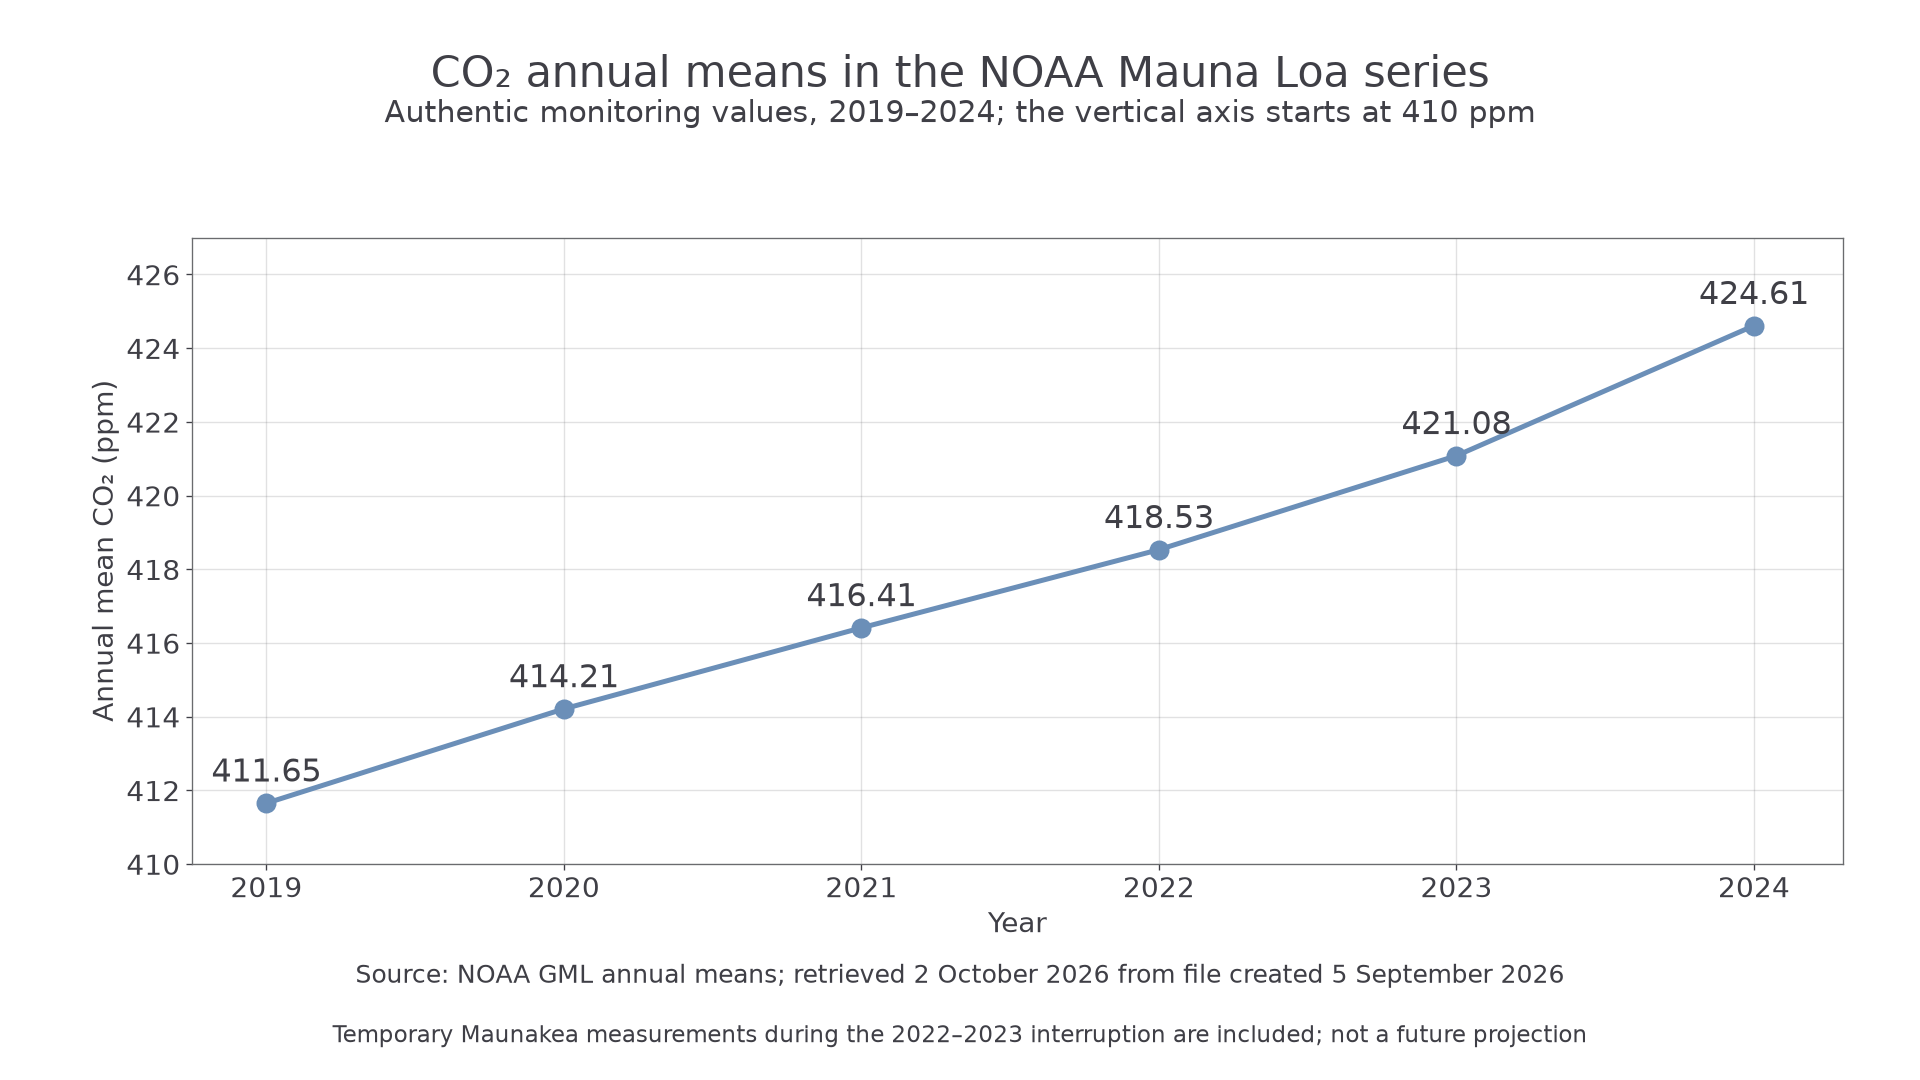
Author-plotted NOAA annual means. The vertical axis starts at 410 ppm to show the change; it does not start at zero. This is a short section of a long monitoring record, not a future projection.
Continue this lesson.
You’re previewing NovaLearn without an account. Create a free account to read the rest.
Create free account