8A.3 - Development policy and international goals
Explain how governments and international organisations turn economic resources into social outcomes. Interpret spending circles and judge development progress using dated SDG evidence with clear denominators.
Government priorities and outcomes
The same national income can produce different health and education outcomes when governments make different spending and distribution decisions.
Welfare state
A system in which government takes substantial responsibility for social protection and access to services such as health and education, financed through taxation and other public revenue.
Economic growth can increase taxable incomes and profits. Governments then choose tax rates, who pays and whether revenue goes to public services, debt interest, security or subsidies. A welfare system can pool risks through pensions, unemployment support and healthcare. Transfers stabilise incomes; preventive care and education can reduce illness and strengthen future productivity. This creates a possible feedback between economic and social development.
The connection is not automatic. Weak tax collection, debt servicing or corruption can limit effective social spending. In an elite-controlled totalitarian regime, spending may protect the ruling group rather than broad public needs, and citizens may lack channels to challenge it. This is one possible pattern on a spectrum, not a rule that every authoritarian state spends little or every democracy provides excellent services. Political priorities, administrative capacity and distribution need direct evidence.
Spending is an input; staffed clinics and classrooms are outputs; improved survival and learning are outcomes. A larger budget can be absorbed by high costs or poor delivery. Judge both resources and results, including inequalities between regions and groups. Social development can also support growth: healthy, educated workers are more productive, so causation can run in both directions.
Proportional spending circles
Proportional circles can compare total public spending while sectors within each circle show competing priorities.
The original illustrative example compares three invented economies; the labels represent broad development contexts, not actual national budgets. All totals use comparable annual US-dollar values. Welfare, health and education are separate, non-overlapping categories here.
| Economy | Total spending, US$ billion | Welfare, % | Health, % | Education, % | Other, % | Population, million |
|---|---|---|---|---|---|---|
| Developing A | 20 | 10 | 15 | 15 | 60 | 50 |
| Emerging B | 80 | 20 | 15 | 15 | 50 | 100 |
| Developed C | 180 | 30 | 20 | 10 | 40 | 50 |
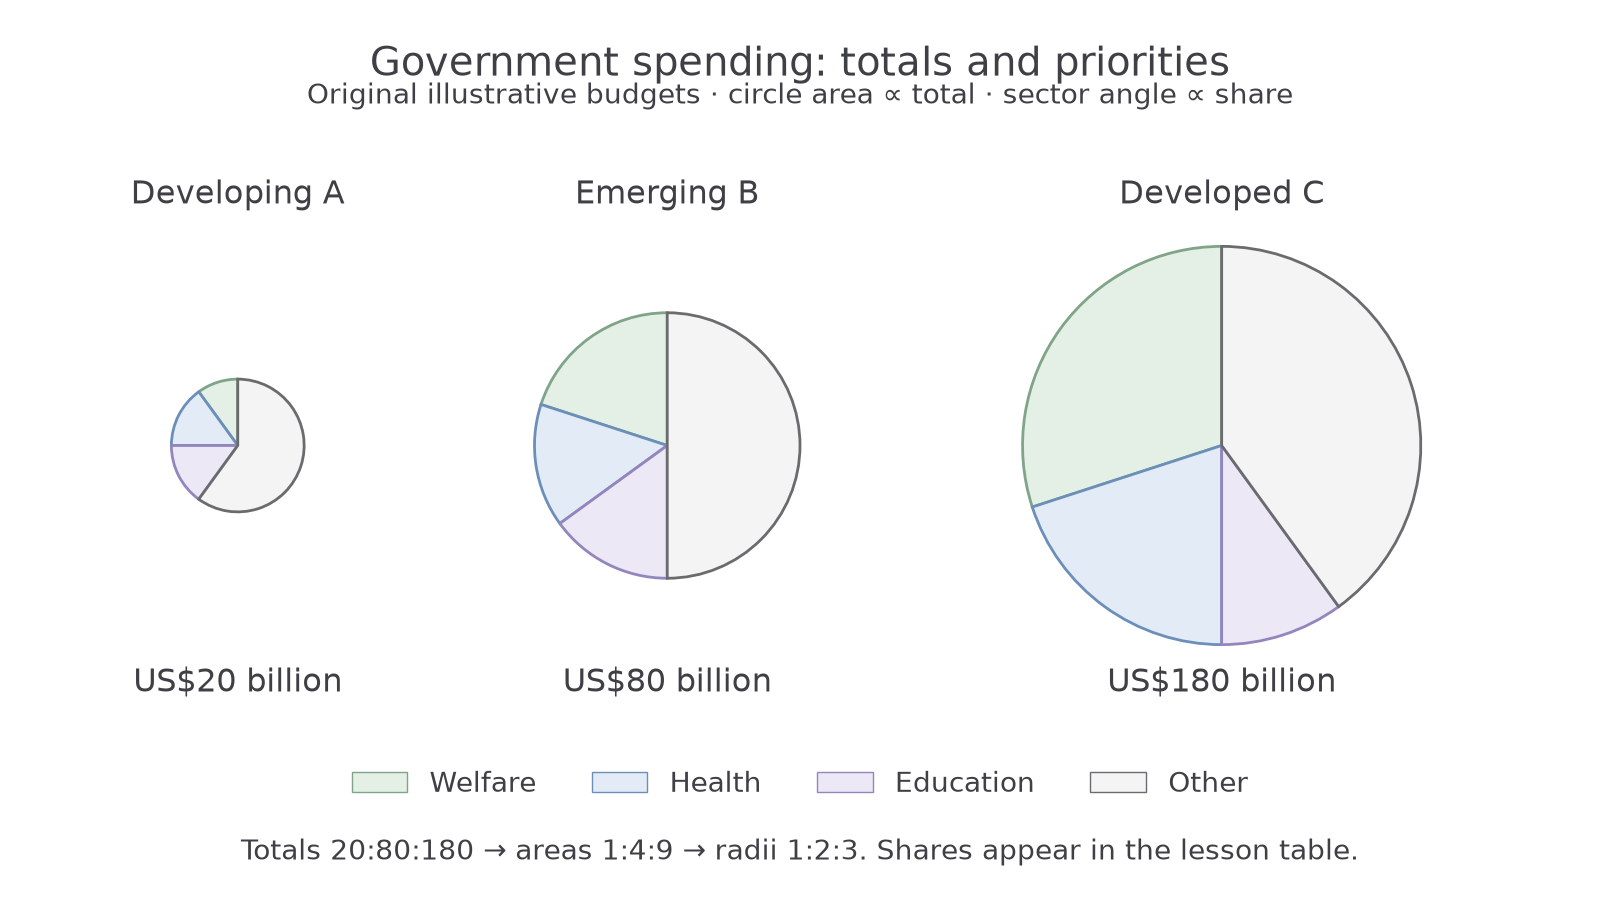
Circle areas represent total spending; sector angles represent shares. Original illustrative values, with radius ratio 1:2:3.
Circle area, rather than radius, must be proportional to total spending. Since area is , B's fourfold total requires twice A's radius. C's ninefold total requires three times A's radius. Making the radius four times larger would exaggerate a fourfold total into a sixteenfold area. A sector angle is its share multiplied by 360°: A's education sector is .
Combine share with total before judging the absolute allocation. Education is 15% in A and B, but the amounts are US$3 billion and US$12 billion. C's smaller 10% share still means US$18 billion. Population also matters: total education spending per person is US$60, US$120 and US$360 respectively. This is spending per resident, not spending per pupil or evidence of learning quality.
When comparing actual countries, specify year, currency basis, public/private coverage and whether values are totals, per person or shares of GDP. Exchange rates and service costs can distort comparisons. On a map, centre symbols consistently and check that large circles do not hide smaller countries. You can construct circles by hand or GIS; the written interpretation here does not certify practical map construction.
Continue this lesson.
You’re previewing NovaLearn without an account. Create a free account to read the rest.
Create free account