1.8 - Forecasting and hazard-management models
Distinguish prediction, forecasting and warning, explain the linked stages of hazard management, and interpret Park's response model without assuming that recovery follows one universal path.
Prediction and forecasting
Scientific information can identify likely hazards without specifying exactly when an event will occur.
Prediction, forecasting and warning
A precise prediction states an event's time, place and size. A forecast expresses the likelihood or expected characteristics over a stated area and period. A warning communicates an imminent or detected threat so that people can act.
Scientists cannot currently make reliable precise earthquake predictions. Fault mapping, past ruptures and measured strain support probabilistic forecasts and hazard maps, often over years or decades. After a large earthquake, aftershock forecasts can estimate changing probabilities over shorter windows. A statement such as an original illustrative “20% chance of a magnitude 7 or larger event in 30 years” is neither a scheduled date nor a 20% chance on every day. USGS earthquake prediction guidance.
Volcano forecasting has more potential because rising magma can produce measurable unrest. Seismometers record earthquake changes; deformation instruments detect swelling; gas and thermal observations provide further evidence. Interpret several signals together with the volcano's past behaviour. Unrest may subside, a signal may have more than one cause, and the timing or style of eruption can remain uncertain.
At Pinatubo in 1991, PHIVOLCS and USGS scientists combined rapidly installed monitoring, geological evidence and observations to support alerts and evacuation before the climactic eruption. The scientists' own account describes the risk that premature warnings would disrupt livelihoods and weaken trust. This success illustrates informed forecasting, not perfect prediction for every volcano. PHIVOLCS–USGS scientific account.
Accuracy depends on location as well as type. An instrumented volcano with accessible records is easier to investigate than a remote centre with few instruments and a poorly known eruption history. Offshore ruptures may be initially located or sized imperfectly. A precise-looking map can conceal sparse observations. Scientists should state uncertainty and update advice; emergency planners must decide how to act on it.
Turning detection into action
A warning reduces harm only if detection, communication and feasible action fit within the available lead time.
Earthquake early warning detects a rupture after it starts. Faster seismic signals and communications can reach some places before strong shaking, creating seconds of useful notice. Close to the source there may be little or no lead time. Automated actions can stop trains or isolate equipment; public warning is not the same as predicting the earthquake beforehand.
Tsunami warning also generally follows detection of a generating event. Scientists use seismic information, sea-level observations and models to estimate arrival times and threatened coasts. A travel-time estimate is not an exact inundation map: wave size, bathymetry, tides and coastal topography affect local flooding. Distant coasts may have hours for evacuation; nearby coasts may have only minutes, shorter than the time needed to issue a formal warning.
The Kaikōura 2016 post-event report recorded changing scientific assessments as the complex rupture became clearer. It stressed that nearby people should recognise natural warning signs rather than depend entirely on an official alert arriving first. Strong or prolonged coastal shaking can therefore be an immediate evacuation cue under local guidance. Education, marked routes and assistance for people with limited mobility determine whether the physical lead time is useful. MCDEM report, pp9–10.
For an original illustrative warning exercise, a modelled first-wave arrival is 14:40. Detection is 14:10, scientific analysis takes 6 minutes and communication takes 4 more. An alert reaches residents at 14:20, leaving 20 minutes before the modelled arrival. If reaching safe ground takes 25 minutes, the formal process alone is inadequate. Faster communication, nearer vertical refuges or action on natural signs may be needed. Arrival and travel times remain uncertain, so a plan needs a safety margin.
The hazard management cycle
Hazard management links action before, during and after an event so that lessons from one disaster reduce the next disaster's losses.
| Stage | Purpose and example | Why it matters |
|---|---|---|
| Mitigation | Reduce potential harm: retrofit a hospital, control risky development or strengthen a seawall | Limits damage before emergency services are needed |
| Preparedness | Organise action: practise evacuation, prepare shelters and stock supplies | Turns a warning or sudden onset into an effective response |
| Response | Immediate protection and relief: rescue, emergency medical care, safe water and temporary shelter | Reduces avoidable deaths and cascading harm |
| Recovery | Restore livelihoods, services and housing; rebuild more safely | Determines whether disruption persists and whether future vulnerability is recreated |
Emergency planners coordinate agencies, transport, communication and priorities. They must identify who is exposed, which facilities may fail and how support reaches isolated communities. Local knowledge can locate unrecorded households and practical access problems; national organisations can mobilise resources beyond local capacity.
The stages overlap. A hospital may resume care while other districts still need rescue. Rebuilding a damaged bridge is recovery, but changing its design to withstand a future event adds mitigation. Recovery can include preparedness improvements from a debrief. Resources devoted only to response may leave the causes of vulnerability untouched; equally, long-term engineering cannot replace immediate food and medical care.
Decisions involve time and trade-offs. An evacuation order can save lives but disrupt income and risk public fatigue if repeated without clear explanation. A rapid rebuilding programme may restore housing yet reproduce unsafe sites. Measure success by outcomes and distribution—survival, service continuity and who can recover—not simply by the amount of aid announced.
The cycle is a planning framework. Its value is connecting prevention, readiness, emergency action and safer recovery; it does not require every place to pass neatly through four separate phases.
Interpreting Park's response curves
Park's model represents how a community's quality of life changes through disruption and recovery after a hazard event.
The horizontal axis is time; the vertical axis is a defined measure of quality of life or functioning. A pre-event baseline is followed by a fall as homes, services and livelihoods are disrupted. Relief can stabilise conditions, rehabilitation restores functions, and reconstruction may return the community to its previous level, leave a persistent deficit or improve safety and services. These phases describe the response curve and are related to, but not identical to, the hazard management cycle.
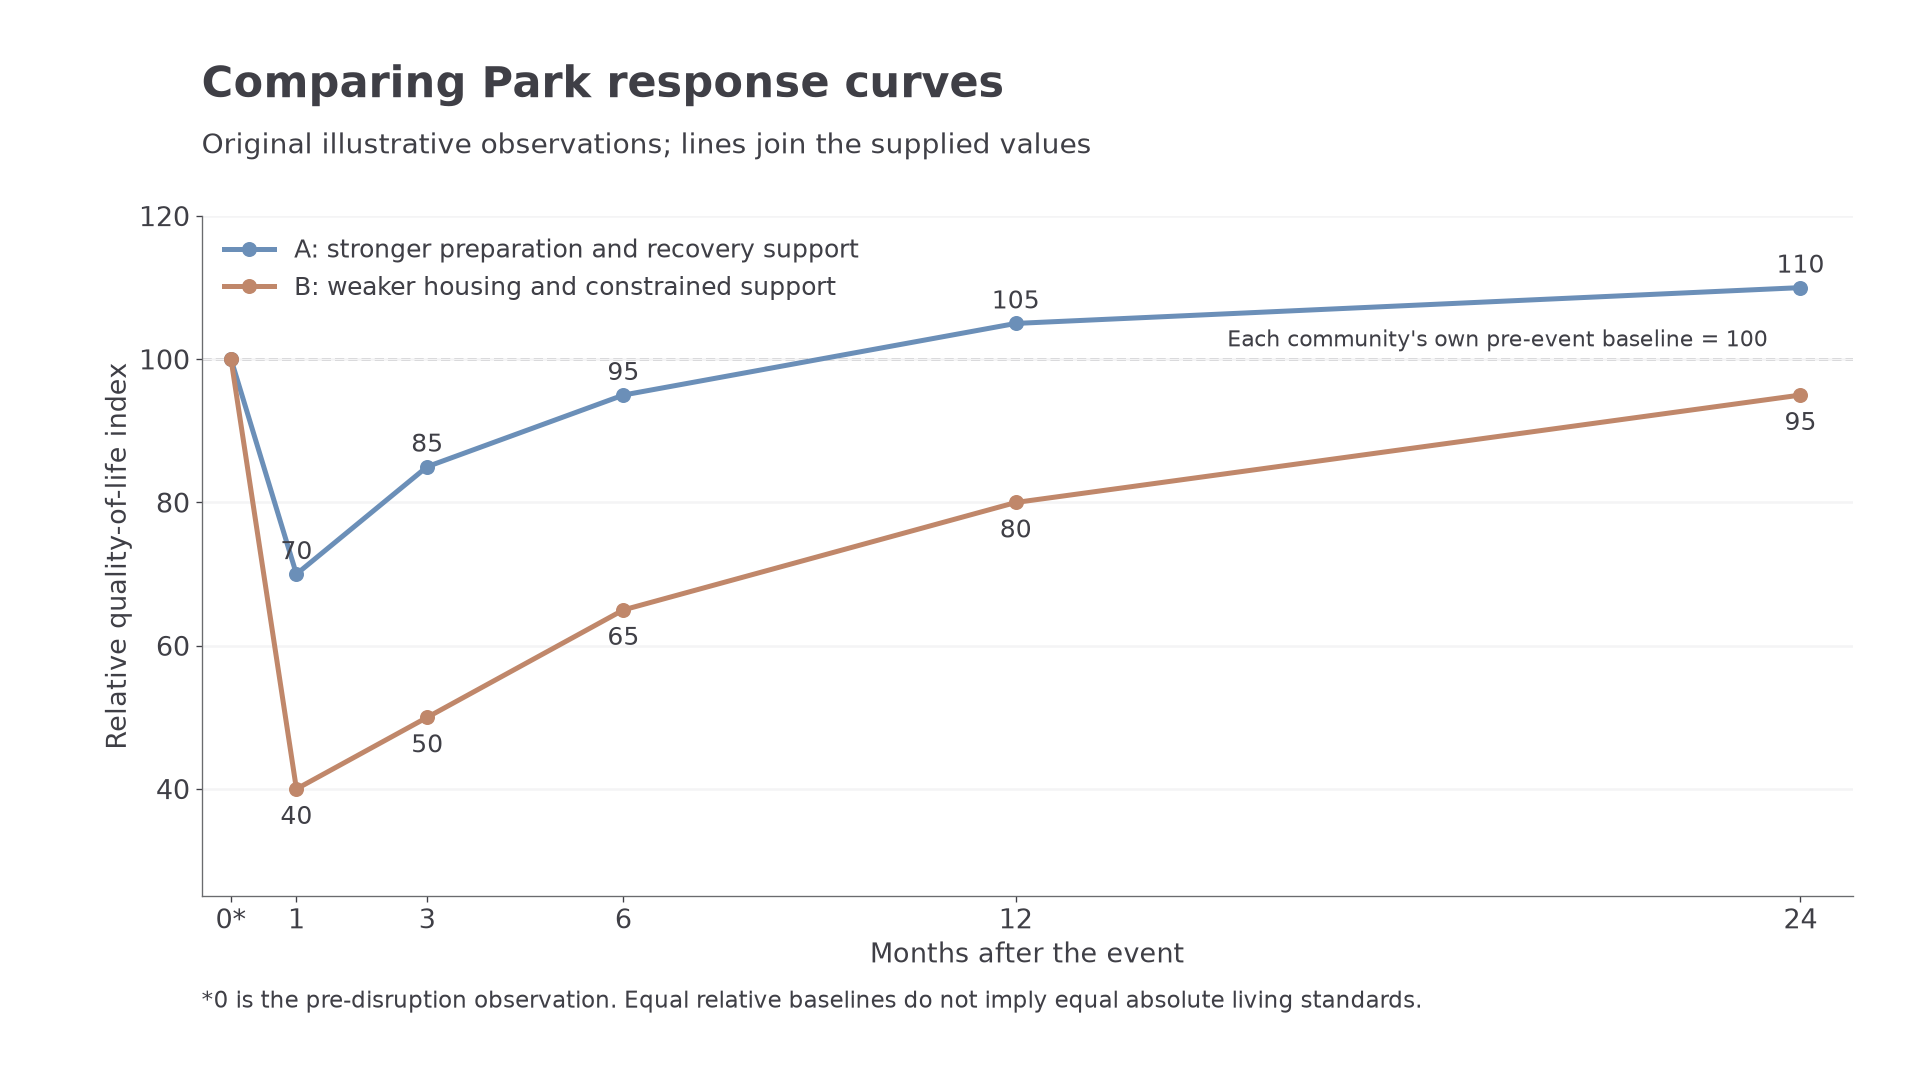
Two relative response curves show different depth and duration of disruption. Each community's own pre-event baseline is 100.
The plotted values below are original illustrative scenarios, not measurements from named countries. Each community's own pre-event level is set to 100, so equal starting values do not imply equal incomes or absolute living standards. Lines simply join the supplied observations.
| Months after the event | 0, before disruption | 1 | 3 | 6 | 12 | 24 |
|---|---|---|---|---|---|---|
| A: effective preparation and well-funded reconstruction | 100 | 70 | 85 | 95 | 105 | 110 |
| B: weaker housing and constrained access to recovery support | 100 | 40 | 50 | 65 | 80 | 95 |
A's measured decline is 30 index points by month 1; B's is 60. A is above its baseline by month 12, whereas B remains 5 points below its baseline at month 24. Preparation may reduce collapse and keep services functioning, explaining a shallower drop. Accessible finance, skilled workers and effective coordination can accelerate restoration and support safer rebuilding.
Development can influence these capacities, but it does not determine a curve automatically. A wealthy community facing extreme inundation, contaminated land or insurance disputes may recover slowly. A lower-income community with effective evacuation and strong local organisation may avoid a deep fall. Hazard severity, exposed assets, governance and external assistance all affect the shape.
The model simplifies reality. A single community average conceals renters who remain displaced while owners rebuild, and physical rebuilding can advance while trauma persists. Different indicators give different curves; GDP growth from reconstruction is not necessarily improved wellbeing. Repeated aftershocks, storms or disease can cause further dips. Comparison needs a clear baseline, common indicators and counting periods. Use a curve to ask why trajectories differ, then test the explanation against event evidence.