2B.8 - Coastal retreat and its changing rates
Learn how waves, geology, slope processes and human intervention combine to cause retreat, and how to measure change without assuming that a long-term average predicts each year.
Geology, waves and the sediment budget
Coastal recession is the landward movement of a coastline or cliff edge. Weak unconsolidated deposits can be removed quickly; resistant rock may retreat slowly until joints, faults or bedding planes permit failure. Permeable beds above less permeable material can concentrate water at boundaries. Rock type alone is therefore an incomplete explanation: structure, groundwater and exposure also matter.
Waves remove material by hydraulic action and abrasion, undercutting cliffs and clearing fallen debris. A beach absorbs energy and protects the cliff foot. If sediment outputs exceed inputs, the beach narrows and more energy reaches the cliff. Dredging can remove sediment from a connected nearshore store; dams can reduce river sediment supply; groynes or harbour structures can intercept drift. Their effects depend on location within the sediment system, rather than on the mere existence of a structure.
The Californian coast provides a useful warning against treating every beach as naturally retreating at one fixed rate. USGS research reported on 2 February 2026 found local widening associated with nourishment and sediment trapping by built structures. Apparent beach growth can therefore reflect intervention, while another part of the cell may lose supply. Widening of the waterline beach does not by itself establish that the cliff behind is stable.
Weathering and mass movement work with waves
Processes above the waterline weaken a cliff before the sea removes it. Freeze-thaw can widen water-filled cracks; salt crystallisation and chemical weathering can weaken rock near the surface. Rainfall infiltrates soil and joints, adding weight and raising pore-water pressure. Higher pore pressure reduces effective friction, allowing blocks to slide or clay-rich material to slump along a curved slip plane.
Wave erosion removes support at the cliff foot, increasing slope instability. A slump then delivers debris to the shore, briefly creating a protective apron. Waves eventually remove that debris and renew undercutting. Retreat is therefore often episodic: a cliff can appear unchanged for months and then lose several metres in one failure. A photograph taken immediately after failure may exaggerate a typical annual rate, while one taken during stability may understate the long-term threat.
Drainage can reduce saturation, but a dry period does not remove fractures or guarantee stability. Explain the complete sequence—weakening, loss of support, failure, debris removal—rather than labelling all cliff retreat as wave erosion.
Storms and seasons change the rate
Wind direction determines whether waves approach a coast directly and whether they travel over a long fetch. Longer fetch, stronger winds and longer duration can generate larger waves, but a change in direction may shelter one frontage while exposing another. High tides raise the level at which waves attack; high tide coinciding with a surge can reach previously protected cliff material.
Winter storm sequences can remove a protective beach before the next storm arrives. Wet seasons may saturate cliffs, so rainfall and marine attack reinforce each other. In calmer conditions onshore sediment movement can rebuild a beach. Over decades, sea-level change, altered sediment supply and management change the baseline. A short storm-driven acceleration and a long-term trend require different evidence.
Recession rates describe an interval and a measured feature. They are not universal constants or a promise that every future year will lose the same distance.
Measure intervals using maps, aerial photos and GIS
Compare the same feature at the same transect through time. A cliff top is usually more stable as a mapping reference than the instantaneous waterline, which changes with tide and waves. Georeference images against unchanged control points; use a common projected coordinate system in metres; digitise each dated cliff edge; draw transects normal to the local coast and measure landward displacement. Check scale, image resolution, edge ambiguity and positional error before claiming change.
Report the feature, interval, units and sign convention. This is a mean over the interval, not the rate during each event.
The graph and table use original illustrative cliff-top distances from a fixed inland baseline. Smaller distance means recession towards that baseline.
| Year | Distance from baseline (m) |
|---|---|
| 2000 | 120 |
| 2010 | 100 |
| 2015 | 95 |
| 2016 | 87 |
| 2020 | 83 |
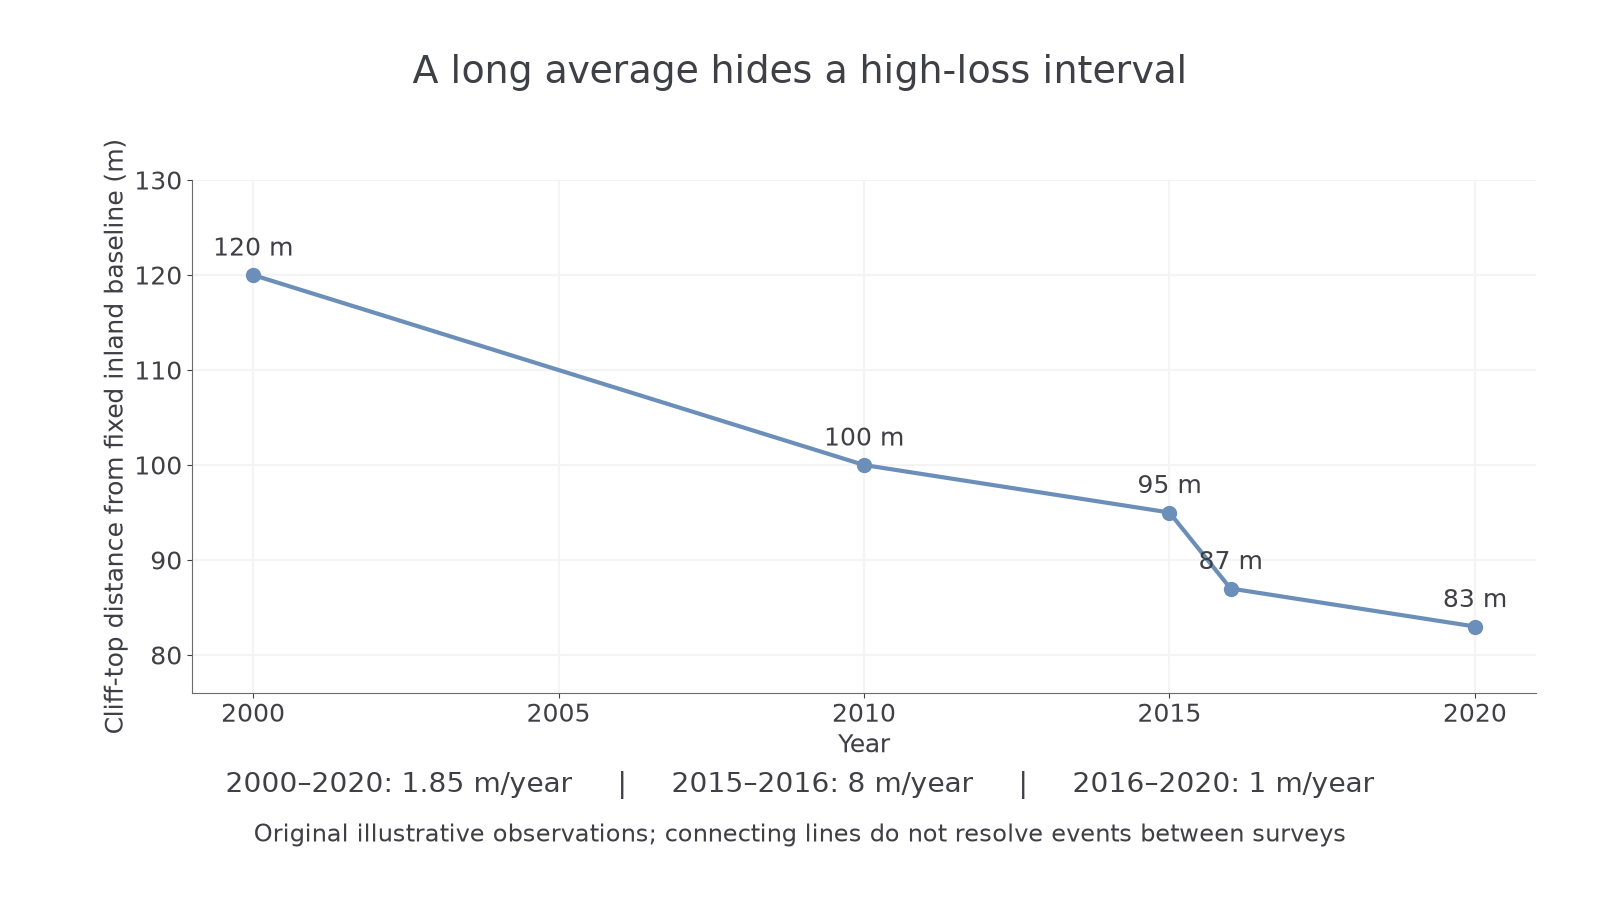
Original illustrative data. Straight segments join observations; no measurements establish the timing of retreat between them.
For 2000–2020, . For 2015–2016, ; for 2016–2020, . The long average conceals the high-loss year. It does not prove a storm caused that loss: compare storm, rainfall, geology and intervention records.
If each cliff position is uncertain by ±1 m, displacement over an interval could differ by up to 2 m in a conservative worst-case comparison. That is ±2 m/year over one year but ±0.1 m/year over twenty years. Small annual changes may therefore be unresolved, while long averages hide genuine events. More observations improve timing; they do not remove systematic mapping bias.