5.5 - Flood causes and consequences
Learn how rainfall and snowmelt create flood surpluses, how people change catchment responses, and why the same event produces different environmental and social losses.
Creating a flood surplus
Flooding occurs when water reaches a place faster than it can infiltrate, be stored or be carried away. A river floods when discharge exceeds channel capacity; surface-water flooding can occur before water reaches a river, when runoff exceeds drainage capacity. A water surplus is therefore relative to the capacity of a particular system, not simply a high annual rainfall total.
Flash flood
A rapid rise of water, usually following intense rainfall over a short period, which gives little warning before inundation.
A convective storm can deliver rain faster than the soil's infiltration capacity. Short intense rainfall over a small, steep catchment produces rapid runoff and a short lag time. By contrast, prolonged frontal rain progressively fills soil and groundwater stores. Once the soil is saturated, further rain generates saturated overland flow even if its intensity is modest. Several tributary peaks arriving together can raise the main river above bankfull discharge.
Extreme monsoonal rain combines moist onshore winds, uplift and sustained rainfall across large basins. The flooded area can remain extensive because downstream rivers integrate rainfall from many tributaries. Snowmelt supplies water without contemporary rainfall: a rapid temperature rise melts accumulated snow, and frozen ground may restrict infiltration. Rain falling on snow can add both rainwater and meltwater. The flood response still depends on antecedent storage, basin size and channel capacity; rainfall alone cannot establish the resulting discharge.
Reading pressure patterns
A synoptic chart shows atmospheric conditions across a region at one time. Isobars join equal sea-level pressure; closer isobars indicate a stronger pressure gradient, usually associated with stronger winds. Low pressure commonly brings rising air, cooling and condensation. A front marks a boundary between air masses: warm air rises over colder air, creating cloud and potential rain. Pressure is measured in hectopascals (hPa), numerically equivalent to millibars.
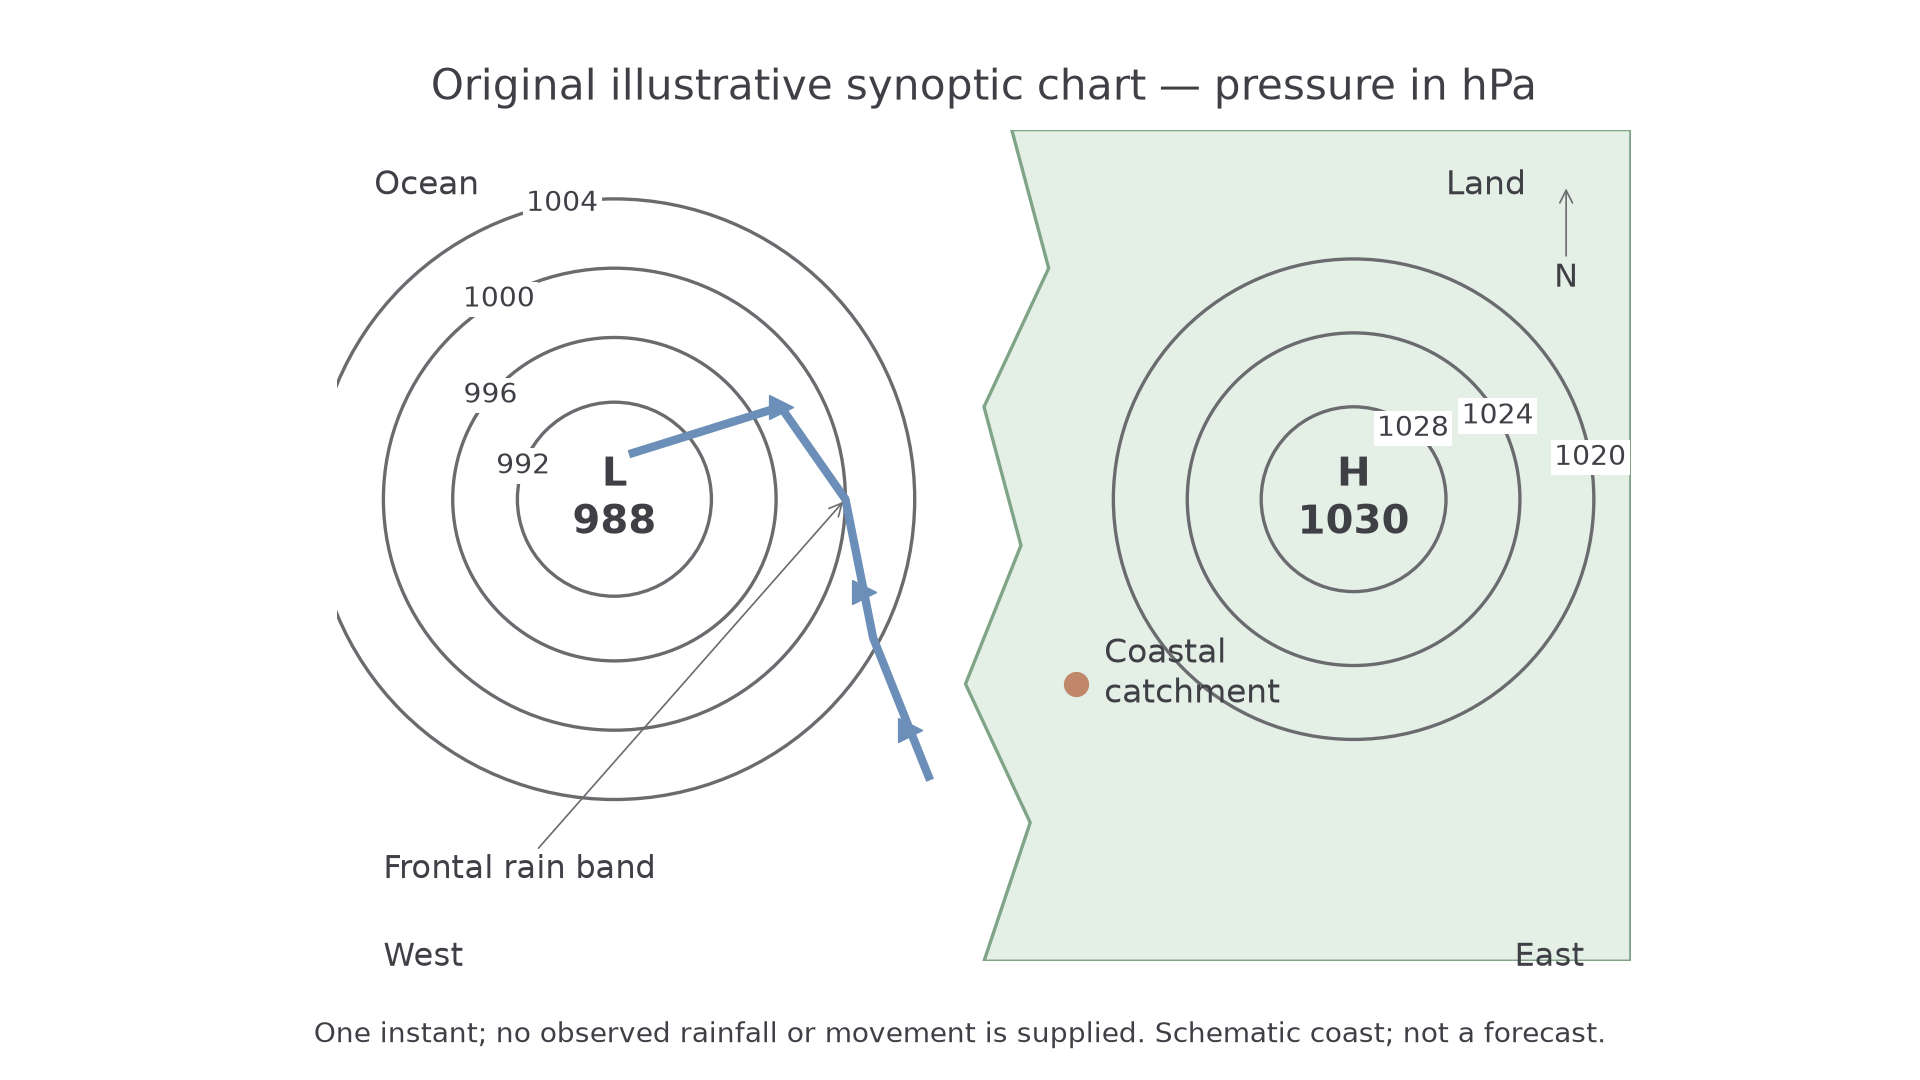
Original teaching chart, not an observed event. Contours and labelled positions are exact for this illustration; the coast is schematic.
Read the chart in stages. The 988 hPa low and frontal rain band are west of the catchment. A sequence of charts showing the low and front approaching and moving slowly across it would support prolonged rainfall, allowing soil stores to fill. One chart alone establishes position, not movement, rainfall amount or a flood forecast. Add radar/rain-gauge evidence, forecast tracks and antecedent soil moisture before inferring flood risk. The Met Office chart guide explains the conventional symbols used on authentic charts.
A persistent high can instead suppress rainfall because descending air warms and inhibits condensation. Repeated charts showing a high remaining over a region provide a mechanism for a precipitation deficit and possible meteorological drought. This contrast is about circulation patterns, not a rule that every low causes flooding or every high causes drought; season, humidity, duration and catchment conditions matter.
Human amplification of flood risk
Land use changes the route and speed of water through a catchment. Removing vegetation reduces interception and may reduce root-created infiltration pathways. Soil compaction by machinery or grazing lowers infiltration capacity. Urban roofs and paved surfaces generate rapid runoff, while drains connect that water quickly to channels. These changes can produce a higher peak discharge and shorter lag time for the same storm. Building on a floodplain also increases exposure: more people and assets occupy the area that can flood.
Continue this lesson.
You’re previewing NovaLearn without an account. Create a free account to read the rest.
Create free account