Appendix 1 2(d)(i) - Lorenz curves and the Gini coefficient
Learn to represent a distribution, calculate its inequality and make a fair geographical comparison. Lorenz curves and the Gini coefficient describe how a total is shared; interpreting them also requires knowing who was counted and what was measured.
Building Lorenz curves
A mean income can rise while the poorest households receive little of the increase, so an enquiry about development needs evidence of the distribution as well as the average.
Lorenz curve
A graph of the cumulative share of a quantity against the cumulative share of its population, with units ordered from the smallest to the largest value of that quantity.
For income, rank individuals or households from poorest to richest. Keep the unit consistent: a household and a person are different counting units. Divide the ordered population into equal-sized groups such as quintiles, each containing 20% of the population. Find each group's share of total income, then add those shares cumulatively. The vertical values are shares of all income, not the income of the household at a particular rank.
The following data are original illustrative figures for two fictional communities, not observations from a real place or learner's fieldwork. Income is non-negative, measured on the same basis and allocated to equal-sized household groups.
| Household group, poorest to richest | Share of income in P (%) | Cumulative household share (%) | Cumulative income share in P (%) | Cumulative income share in Q (%) |
|---|---|---|---|---|
| Before any household | 0 | 0 | 0 | 0 |
| Poorest fifth | 5 | 20 | 5 | 10 |
| Second fifth | 10 | 40 | 15 | 25 |
| Middle fifth | 15 | 60 | 30 | 45 |
| Fourth fifth | 25 | 80 | 55 | 70 |
| Richest fifth | 45 | 100 | 100 | 100 |
Draw cumulative population percentage on the horizontal axis and cumulative income percentage on the vertical axis, both from 0 to 100. Plot the origin, the five cumulative pairs and the final point (100, 100); join successive points. Grouped observations produce straight segments, an approximation to the detailed distribution. Draw the line of equality from (0, 0) to (100, 100). On this line, the poorest 40% would receive 40% of income. In P they receive 15%, and the richest 20% receive 100 − 55 = 45%.
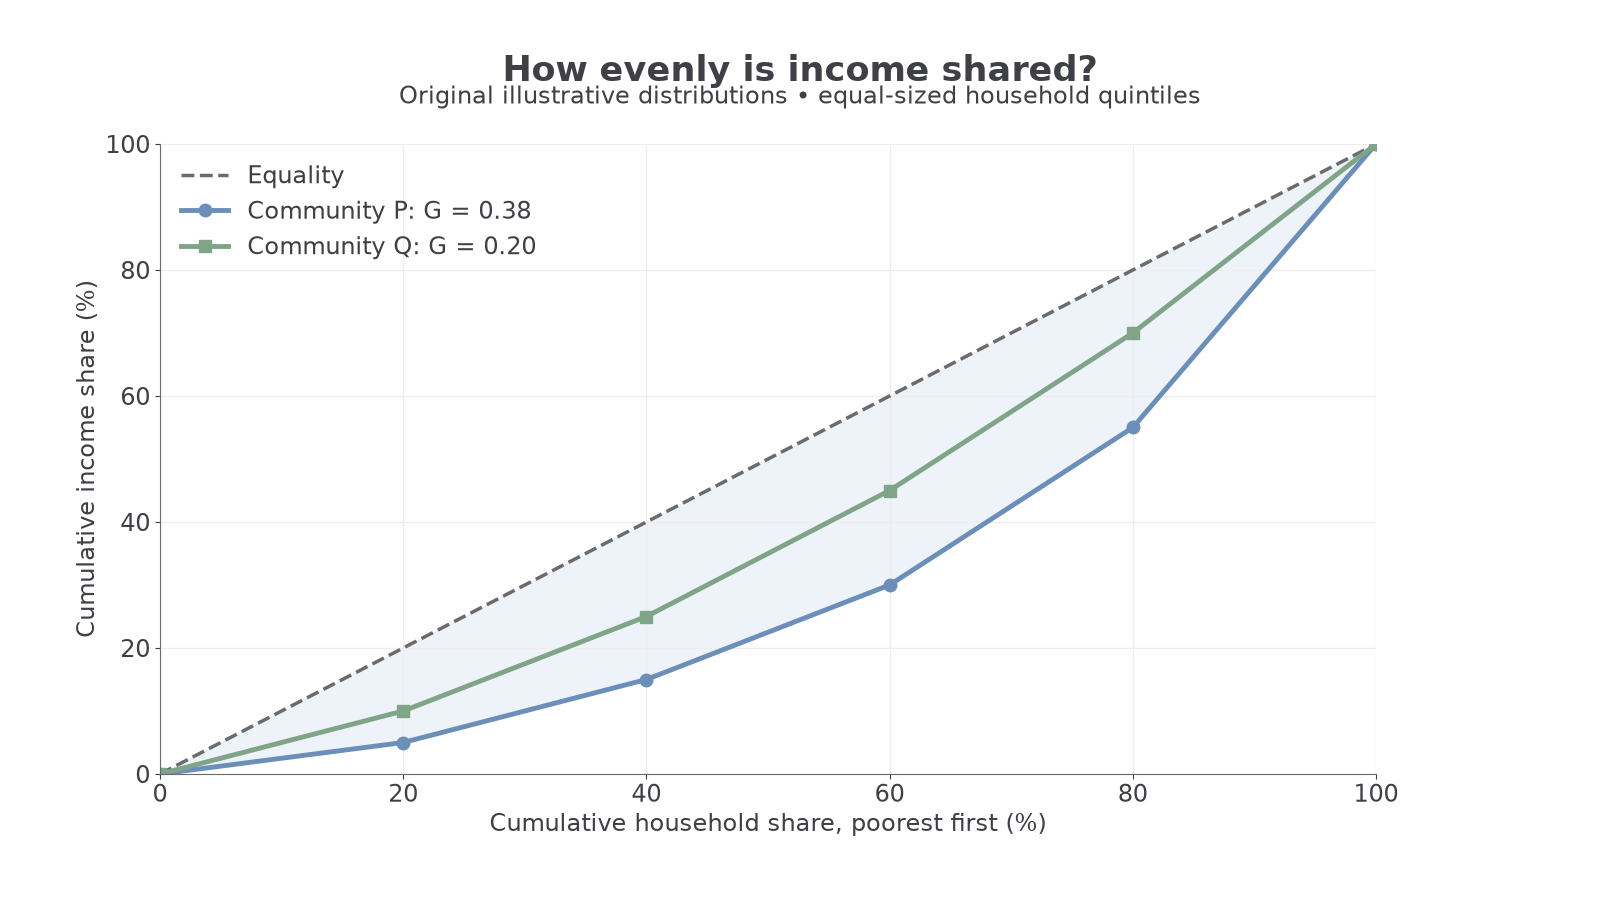
Original illustrative curves: P lies further below equality than Q at every intermediate plotted population share.
For non-negative values, the ordered Lorenz curve cannot fall as more households are included and should lie on or below equality. A curve above the diagonal suggests a ranking or cumulative-total error. Negative incomes require special treatment and can break these familiar bounds; do not apply this elementary construction uncritically to a dataset containing them.
Calculating the Gini coefficient
The area between a Lorenz curve and equality summarises the unevenness across the whole distribution.
Gini coefficient
The area between equality and the Lorenz curve divided by the total area below equality. On the usual non-negative distribution scale, 0 indicates equality and values approaching 1 indicate extreme concentration. A Gini index on a 0–100 scale is 100 times the coefficient.
Use proportions, from 0 to 1, when calculating area. The triangle below equality has area 0.5. If B is the area below the Lorenz curve, the gap has area 0.5 − B, so the coefficient is (0.5 − B)/0.5.
For straight segments between cumulative points:
Here is cumulative population proportion and is cumulative income proportion. Include both (0, 0) and (1, 1). Each term is the area of one trapezium. G has no income unit.
For P, the population increments are all 0.2, and the income proportions are 0, 0.05, 0.15, 0.30, 0.55 and 1.00. The first trapezium has area (0 + 0.05)/2 × 0.2 = 0.005.
Thus P's grouped-data coefficient is 0.38, or an index of 38. For Q, the corresponding areas are 0.010, 0.035, 0.070, 0.115 and 0.170. Their sum is 0.400, giving G = 0.20. Using percentages without converting both axes to proportions would give areas on the wrong scale.
Continue this lesson.
You’re previewing NovaLearn without an account. Create a free account to read the rest.
Create free account