4B.6 - Evidence and representations of place
Learn how to investigate positive and negative images of a place using surveys, relationships and contrasting media, and how representation can shape demographic and cultural perceptions or conflict.
Statistical evidence of image
Statistics can summarise measured perceptions, but a demographic characteristic is not itself an opinion about a place.
A satisfaction survey might ask residents to rate their living space on a clearly defined scale and give an open reason. Define the population, study boundary, period and question; recruit across relevant locations and groups; record refusals and missing answers. Keep residents and visitors distinguishable. A convenience sample outside one venue measures its respondents, not everyone in the place. Census age or ethnic composition can help describe a sample and check under-representation; it cannot establish that residents have a positive or negative image.
An original illustrative survey asks 80 respondents to choose positive, neutral or negative. There are 44 positive, 20 neutral and 16 negative responses: 55%, 25% and 20%. This is a positive balance in this sample, not evidence that every resident is satisfied. Compare groups and locations before combining them: a positive overall balance can conceal a much less positive view among a small group.
For numerical ratings, show the distribution as well as an average. The median is the middle ordered value; the mean is the sum divided by the number of responses. For illustrative scores 1, 2, 4, 4, 4 on a 1–5 scale, the mean is , but the median is 4. A mean hides the dissatisfied minority; ordinal ratings also do not guarantee equally spaced feelings between adjacent scores. Percentages by category and the median can therefore be useful companions.
A comparison over time requires equivalent question wording, sampling, scale and season. More positive replies after a change may reflect a different sample rather than a changed image. Triangulate with interviews and relevant conditions, while retaining the distinction between what people feel and what the place is measured to contain.
Relationships and Spearman's rank
A relationship test investigates whether two paired variables tend to rise or fall together; it does not explain why.
Begin with a scattergraph: put the explanatory variable on the horizontal axis and the measured perception on the vertical axis, with units and one point per paired location. Look for direction, an unusual point and whether the pattern is broadly monotonic, meaning one variable generally increases or decreases as the other increases. A curve or clusters may be missed by a single summary.
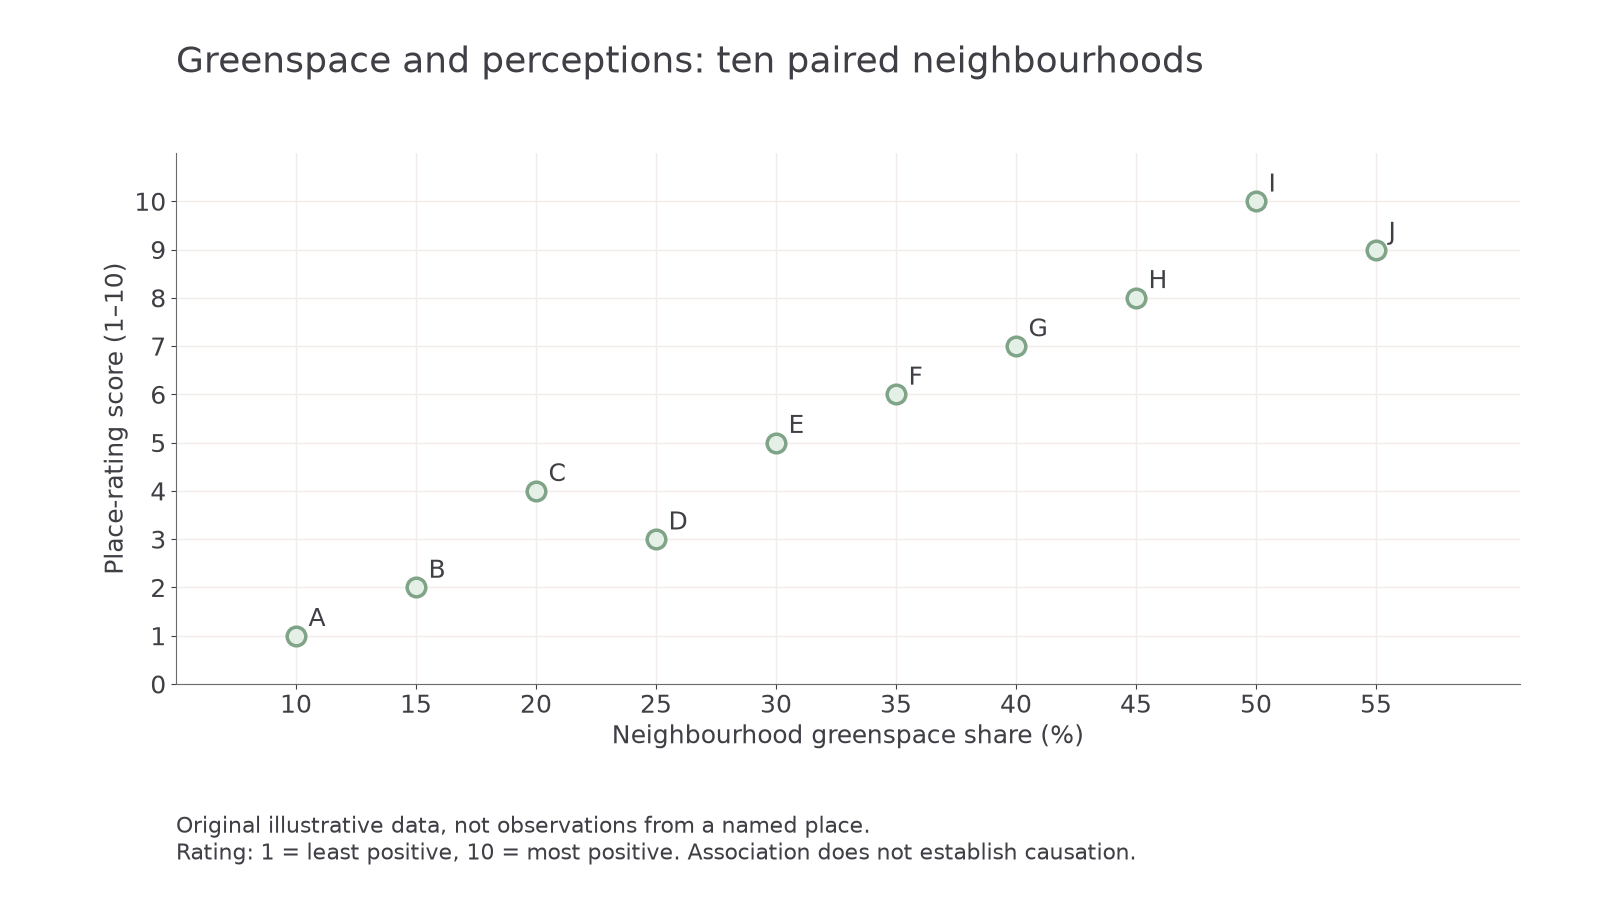
Original illustrative data, not a measured relationship in Stratford, Amble or your own place. A score of 1 is least positive and 10 most positive.
Spearman's rank correlation uses the ordering of paired observations. Rank both variables consistently: either lowest = 1 for both, or highest = 1 for both. Then find each rank difference , square it, sum the squared differences and use the formula.
is the number of paired observations. This simple formula is used here with no tied ranks. lies between −1 and +1: positive values indicate increasing ranks together, negative values opposite ordering, and values near zero little monotonic association.
| Neighbourhood | Greenspace (%) | Rating | Greenspace rank | Rating rank | |
|---|---|---|---|---|---|
| A | 10 | 1 | 1 | 1 | 0 |
| B | 15 | 2 | 2 | 2 | 0 |
| C | 20 | 4 | 3 | 4 | 1 |
| D | 25 | 3 | 4 | 3 | 1 |
| E | 30 | 5 | 5 | 5 | 0 |
| F | 35 | 6 | 6 | 6 | 0 |
| G | 40 | 7 | 7 | 7 | 0 |
| H | 45 | 8 | 8 | 8 | 0 |
| I | 50 | 10 | 9 | 10 | 1 |
| J | 55 | 9 | 10 | 9 | 1 |
Here and , so , a strong positive monotonic relationship in these illustrative pairs. It does not mean greenspace causes 97.6% of satisfaction.
For a formal test, state the null hypothesis of no association and an alternative, choose a significance level and one- or two-tailed test before seeing the result, then use the matching critical-value table for . At a two-tailed 5% level with ten untied pairs, the supplied critical absolute value is 0.648; 0.976 exceeds it, so the null is rejected under the test's assumptions. This does not mean a 5% probability that the null hypothesis is true. A non-significant result means insufficient evidence to reject it, not proof of no relationship.
Continue this lesson.
You’re previewing NovaLearn without an account. Create a free account to read the rest.
Create free account