6.4 - Energy security, mixes and players
Learn how to measure energy consumption and read an energy mix, explain contrasting choices in the USA and France, and identify how governments, companies, producers and consumers influence energy security.
Energy security and energy mixes
Energy security concerns whether people and economies can obtain reliable energy at an affordable cost, including during disruption.
Energy security
Energy security is dependable access to sufficient energy supplies at an affordable price. It involves availability, reliability and affordability; environmental sustainability also affects whether a strategy is durable.
A country can produce abundant energy but still face insecurity if a fuel is unsuitable for its demand, the network fails, prices rise sharply or poorer households cannot afford access. Conversely, imports are not automatically insecure: diverse suppliers, reliable contracts, reserves and several transport routes can reduce exposure. Domestic energy originates within the country; foreign energy is imported. Domestic power generation can still depend on an imported fuel or component.
Primary energy is energy available before transformation, such as coal, crude oil, natural gas, sunlight or uranium's nuclear energy. Secondary energy is produced by converting primary energy, such as electricity, refined petrol or hydrogen. Electricity and hydrogen are carriers rather than original fuel deposits. Conversion losses mean primary-energy input and final energy delivered to users differ; do not add both as though they were separate consumption.
The energy mix is the proportion supplied by different sources within a defined total. Check whether a chart concerns primary consumption, final consumption, electricity generation or installed generating capacity. A country with low-carbon electricity may still use much oil in transport. Capacity in GW is power available at a moment; generation in TWh is energy produced over time. Equal capacity shares do not imply equal annual generation.
Renewable sources such as wind, solar and replenished water flows are renewed on human timescales. Coal, oil, gas and uranium are non-renewable finite stocks. Nuclear generation has low direct operational carbon emissions but is not renewable merely because it is low carbon. Biomass is renewable only under conditions in which replenishment is sustainable. These classifications answer different questions from domestic/foreign or primary/secondary.
Comparing consumption and graphical change
Total energy use, use per person and use per unit of economic output describe different aspects of a country's demand.
State the energy unit, year and GDP basis. Cross-country comparisons should use consistent accounting and comparable GDP measures, such as purchasing-power-adjusted constant prices.
In an original example, Country A consumes 800 TWh in a year, has 40 million people and GDP of 2 trillion comparable currency units. Its consumption per person is kWh. Its energy intensity is kWh per currency unit of GDP. Country B uses 600 TWh with 60 million people and GDP of 1 trillion: 10,000 kWh per person but 0.60 kWh per GDP unit. A uses more per person but less per unit of output. That does not prove every A household or factory is more efficient: economic structure, climate, transport, trade and inequality also matter.
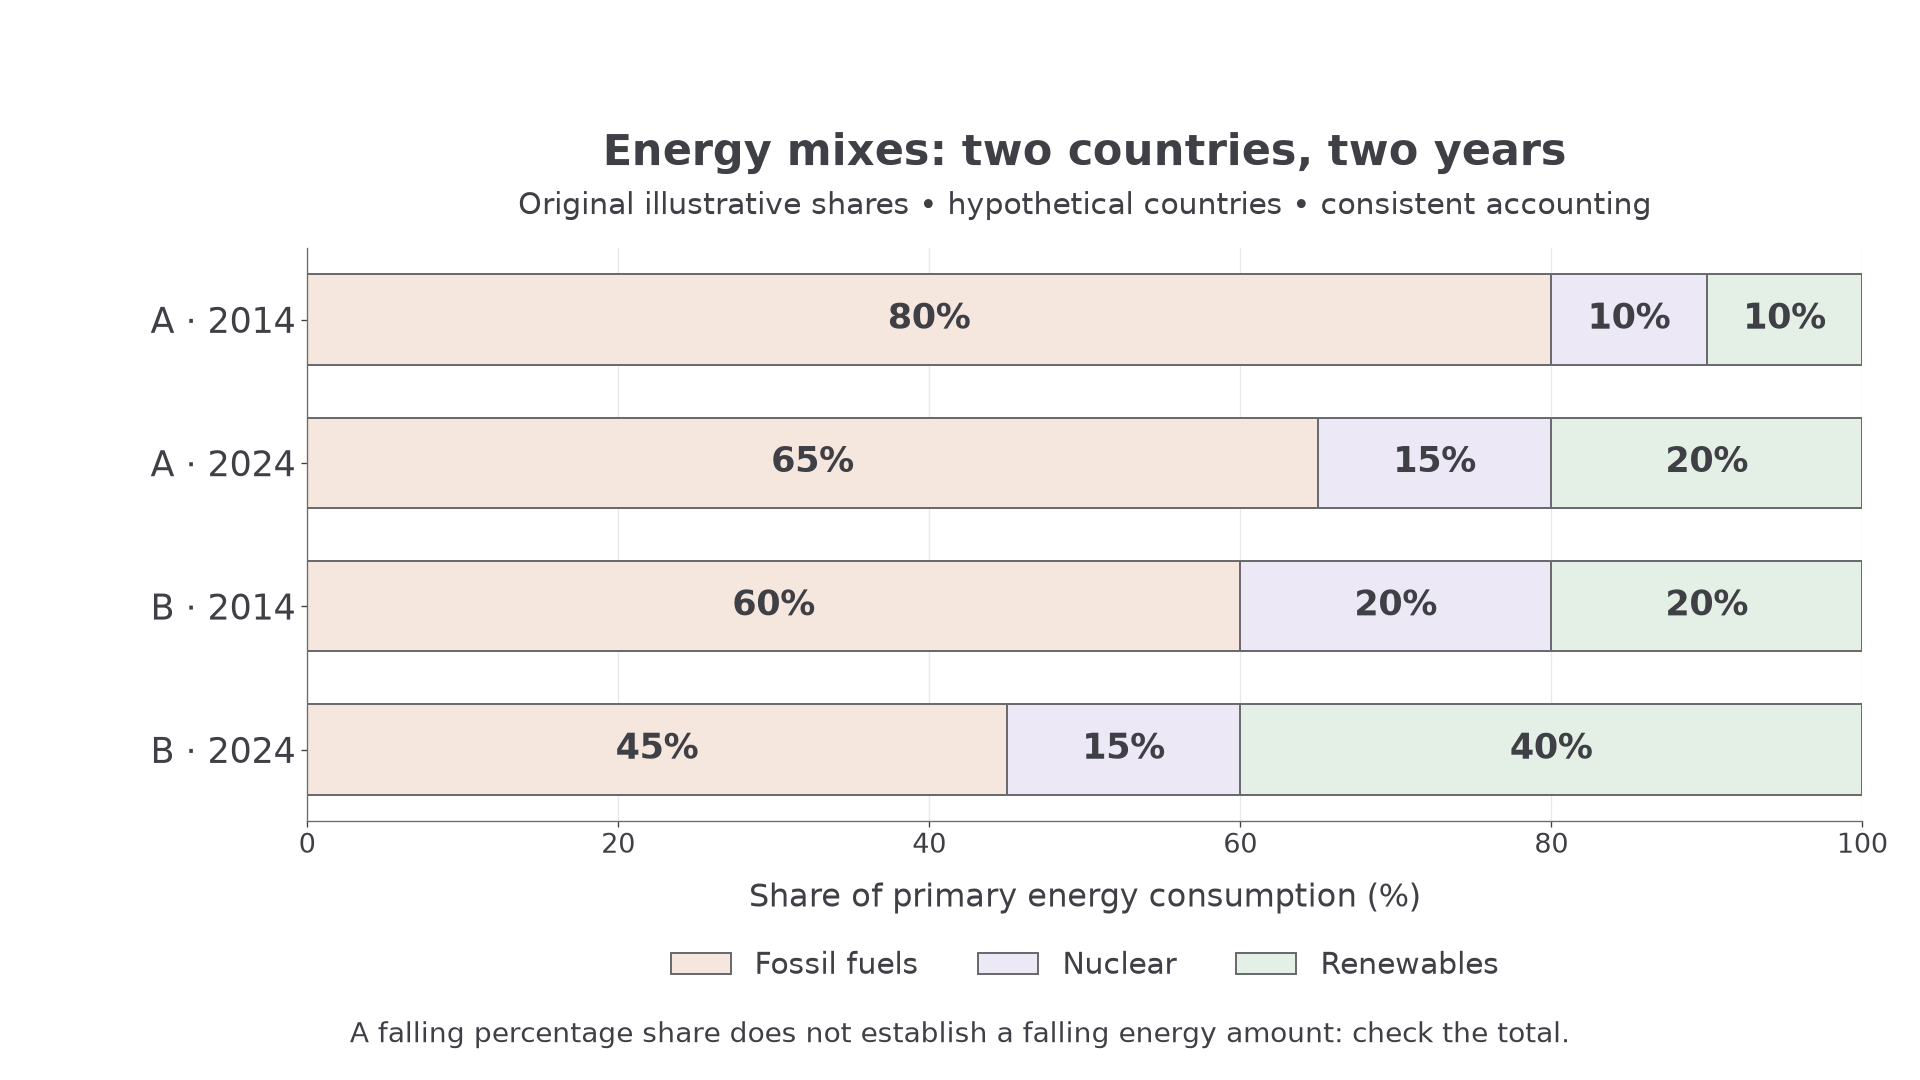
Original illustrative primary-energy consumption shares; Country A and Country B are hypothetical. Totals and accounting are comparable. The chart is not a record for France or the USA.
Read a 100% stacked bar by locating each segment's start and end, not just its top. Country A's fossil share falls from 80% in 2014 to 65% in 2024, a fall of 15 percentage points. Its relative percentage decrease is . Country B also reduces its fossil share, from 60% to 45%. Both shift away from fossil fuels, but B retains the larger renewable share in 2024: 40% against A's 20%.
A falling share is not necessarily a falling amount. If A's total consumption rises from 800 to 1,200 TWh, fossil use changes from to TWh. Its share falls while its fossil consumption rises. Use total bars or an accompanying table to establish amounts. For a time-series comparison, keep categories, unit conventions and time periods consistent, and identify breaks caused by revised statistics rather than real change.
Continue this lesson.
You’re previewing NovaLearn without an account. Create a free account to read the rest.
Create free account