2A.9 - Meltwater processes and fluvioglacial landforms
Learn how meltwater moves through ice, sorts and deposits sediment, creates ice-contact and proglacial landforms, and supports a careful statistical comparison of deposits.
Meltwater pathways through ice
Meltwater connects the glacier surface, its interior and its bed, transferring both water and sediment.
Supraglacial streams flow on the ice surface, supplied mainly by snow and ice melt. Water enters crevasses and vertical shafts called moulins, joining englacial passages within the ice. Water reaching the bed travels through subglacial channels or a more distributed network of cavities and thin water films. Rainfall can also enter this system. Drainage varies through the day, season and glacier life cycle; a channel network can develop as the melt season progresses.
Under thick ice, water can be pressurised. Its route depends on hydraulic potential, influenced by ice-surface elevation and pressure as well as bed elevation. Subglacial water can therefore cross a local bedrock rise, unlike an open river assumed to follow only the bed slope. Water pressure also affects contact between ice and bed and can change sliding rates.
Flowing water entrains sediment when its force exceeds the resistance of grains. Coarse particles move along the bed by traction or saltation; finer material is suspended, and dissolved material is carried in solution. Turbulent high discharge can erode channels and transport large loads. Where velocity and competence decline, sediment is deposited. Water transport, rather than direct release by ice, defines fluvioglacial or glaciofluvial deposits.
Reading deposit characteristics
The texture and structure of a deposit help distinguish direct ice deposition from water transport, but no single feature is infallible.
| Characteristic | Direct glacial deposition | Fluvioglacial deposition |
|---|---|---|
| Sorting | Till is commonly poorly sorted: fine matrix and large clasts together | Water often separates sizes as transport competence changes |
| Shape | Angular/subangular and striated clasts can survive transport in ice; mixed shapes occur | Collisions and abrasion during water transport tend to round clasts |
| Stratification | Till commonly lacks clear water-laid bedding | Successive flows can build distinct sand/gravel layers |
| Fabric | Shearing can align till clast long axes | Flow can produce imbrication: overlapping clasts commonly dip upstream |
| Grading | No necessary systematic grain-size sequence | A layer may fine upwards as a flow wanes; size can also decrease downstream |
Stratification means layers; sorting describes how similar grain sizes are within a deposit. A deposit can have many layers while each layer has imperfect sorting. Grading describes a systematic size change within a layer or along a transport route, not simply the existence of layers. Imbrication provides a possible flow direction where tilted clasts are measured consistently; a horizontal long-axis bearing alone does not establish which way water moved.
An outburst flood may deposit a poorly sorted load, and water can rework till into a sorted deposit. Different clast lithologies round at different rates. Combine a logged section, clast size/shape measurements, fabric, landform position and evidence of reworking before identifying the environment.
To compare numerical samples, calculate the mean by dividing the sum by the number of observations. Find the median as the middle of the ordered values, averaging the middle two for an even sample; calculate the range as maximum minus minimum. These describe different aspects of a distribution.
For original illustrative five-clast samples measured by long-axis length, till values of 2, 5, 10, 30 and 250 mm have mean mm, median 10 mm and range 248 mm. Outwash values of 24, 28, 30, 32 and 36 mm have mean and median 30 mm and range 12 mm. The till's larger mean is dominated by one large clast; its median is smaller. The outwash sample is more tightly grouped, supporting better sorting at that sampled position. Five selected clasts cannot represent an entire deposit reliably, so use a larger unbiased sample and compare full distributions, not just one mean.
Ice-contact meltwater deposits
Water-laid sediment supported or confined by ice can remain as raised landforms when that ice melts.
An esker is a winding ridge of stratified sand and gravel deposited by meltwater, often within a subglacial tunnel. Sediment accumulates where transport capacity declines; repeated deposition can build the ridge while ice confines the channel. When ice disappears the deposit stands above the surrounding surface. The ridge records a former drainage route, which need not match the modern surface river.
A kame is an irregular mound of sand and gravel deposited in a hollow or pond on or beside ice. As the supporting ice melts, the sediment settles, often with collapse structures. A kame terrace forms where meltwater flows and deposits sediment between the valley wall and the glacier margin. Retreat removes the ice side of the channel and leaves a terrace along the valley side. Eskers, kames and kame terraces therefore differ in the position of their depositional water body, even though all may contain sorted, layered sediment.
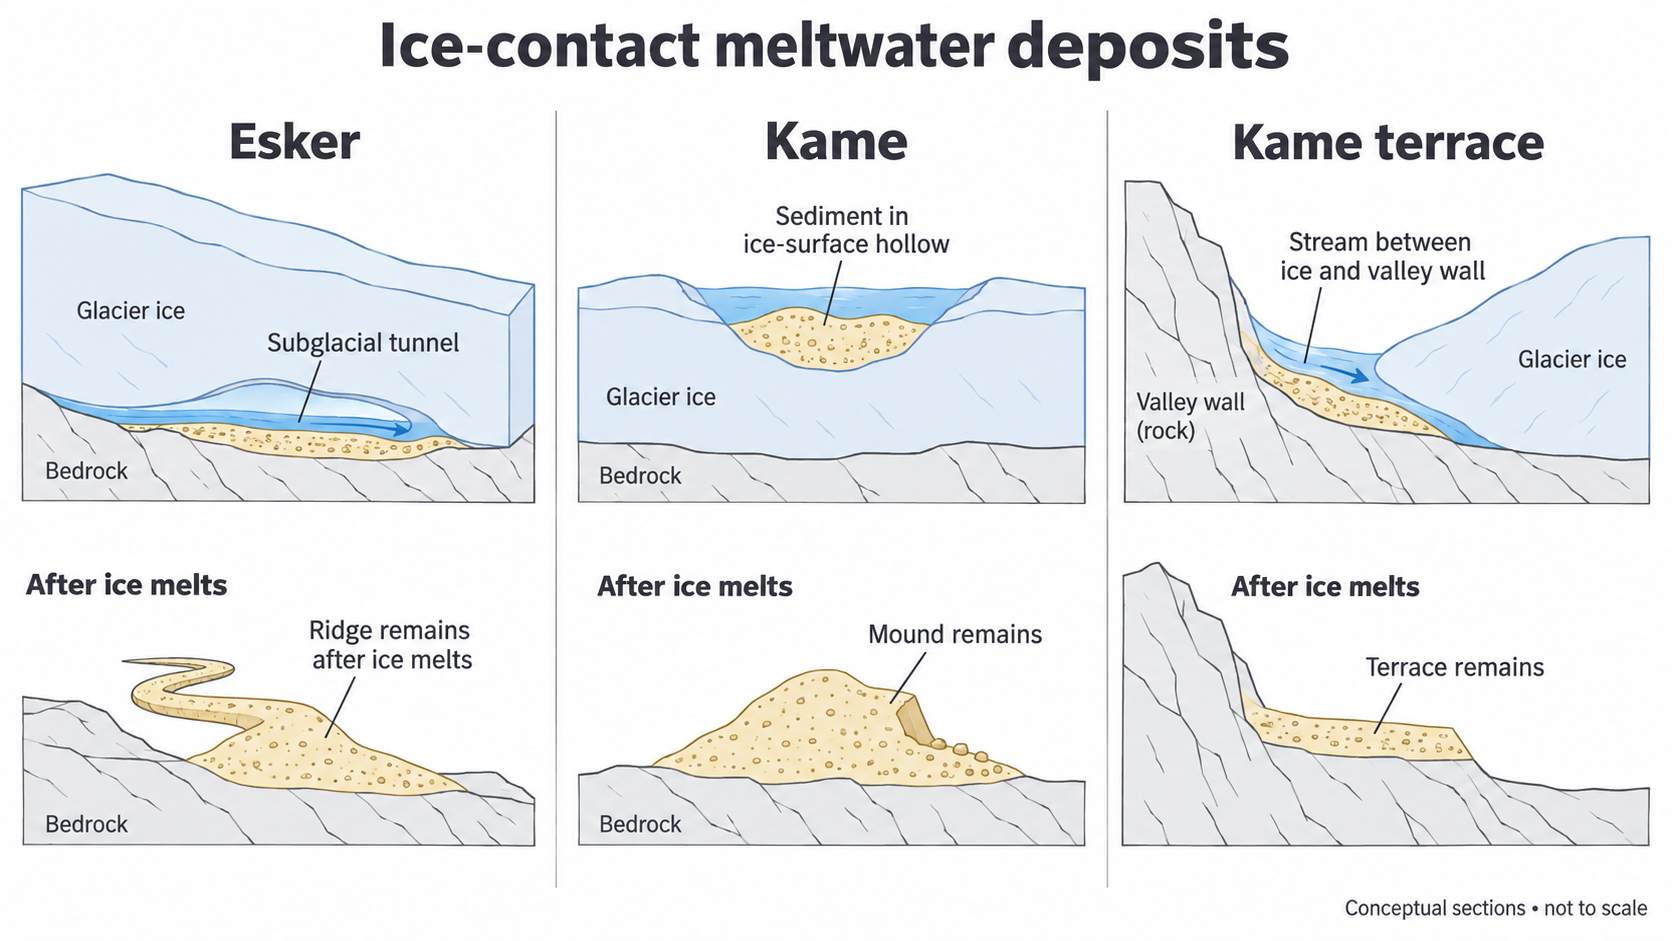
The diagram is conceptual, not a surveyed landform. Collapse after melt-out and later river erosion can make real features less regular. Use their sediment and spatial context as well as their outline when interpreting them.
Landforms beyond the ice margin
Proglacial landforms develop in front of the glacier, where rapidly changing water and sediment supplies meet an exposed landscape.
A sandur, or outwash plain, develops as sediment-laden meltwater spreads beyond the margin. Loss of competence deposits coarse material near channels and the ice front; sand and finer particles can travel farther. Shifting sediment loads and channel deposits promote a braided network. Icelandic sandurs are a useful active-landscape example, while relict outwash plains preserve former meltwater routes after ice retreat.
Proglacial lakes collect water where ice, moraine or a bedrock barrier impedes drainage. Coarser sediment is deposited near inflows while finer suspended material can settle farther into quiet water. The lake can trap sediment and alter downstream discharge. A barrier that fails may release an outburst flood, so the lake is both a landform and a potential hazard.
Meltwater channels form where flowing water erodes rock or sediment. Some now appear oversized for their streams or dry because the former glacier supplied much more water or because drainage was rerouted. Channels may develop alongside or beneath ice before becoming exposed; their present position alone does not prove the original flow was proglacial.
Kettleholes form when detached blocks of stagnant ice become buried or partly buried in outwash. Melting removes their support and the overlying sediment subsides, leaving hollows; those reaching the water table may contain lakes. They are not excavated by the rotating action of moving glacier ice. An assemblage of kettles, sorted sand/gravel and braided-channel traces supports an outwash interpretation more strongly than an isolated pond.
Testing differences between sediment samples
A statistical test can assess a difference between sampled means, provided sampling and the form of data justify the test.
Choose comparable deposits and use the same measurement, such as clast long-axis size in millimetres. Sample randomly or systematically across an area and avoid measuring neighbouring clasts from one patch as if they represent many independent sites. For an outwash downstream enquiry, compare equivalent channel environments at two distances. Otherwise a change in deposit type or sampling method may be mistaken for downstream sorting.
State the null hypothesis: the two population mean sizes do not differ. An independent-samples Student's t-test with pooled variance is appropriate for reasonably normal continuous observations from independent samples when population variances can reasonably be treated as equal. Small, very skewed samples or extreme outliers undermine it; consider transformation or a suitable non-parametric test. With unequal variances, a Welch test uses different variance handling and degrees of freedom. A t-test cannot be applied mechanically to category names such as “angular” and “rounded”. Shape may be compared descriptively, or by a consistent numerical roundness measure if treating it as continuous is defensible.
For the equal-variance independent-samples test:
Here is a sample mean, a sample variance and a sample size. Variances use squared measurement units; is dimensionless. Degrees of freedom are .
In an original illustrative outwash comparison, ten independent upstream clasts have mean 48 mm and variance 100 mm²; ten downstream clasts have mean 32 mm and variance 100 mm². Thus pooled variance is mm². The standard error is mm and . There are 18 degrees of freedom. Against a supplied two-tailed 5% critical value of 2.101, is larger, so reject the null of equal population means under these assumptions.
For shape, an original illustrative comparison uses the same image-measurement protocol to obtain a dimensionless roundness index from 0 (very angular) to 1 (very rounded). Suppose two independent ten-clast samples have means 0.35 and 0.55, each with variance 0.01, and treating their observations as approximately normal continuous measurements with equal variances is justified. Then . Its magnitude exceeds 2.101 at 18 degrees of freedom, supporting different mean roundness under these assumptions. The negative sign simply reflects which sample was subtracted; it is not a failure of the test. Rounded category scores or strongly bounded/skewed observations may need a different method.
This supports a real difference in mean clast size in the sampled environments. It does not prove distance caused it, that every downstream clast is smaller, or that the null has only a 5% probability of being true. Greater downstream sorting is one explanation to test alongside tributary inputs, lithology and discharge differences. Compare the mean and median, a spread measure and the size/shape distributions for glacial and fluvioglacial deposits. Use the same approach for contrasting UK and overseas sites, with source dates, sample boundaries and measurement uncertainty recorded. Written interpretation of supplied results develops the skill; it does not certify a learner's own sampling or graph construction.