4B.8 - Segregation and changing lived experiences
Learn how residential clustering relates to economic and social conditions, how to measure diversity without confusing it with segregation, and why cultural landscapes and lived experiences change across generations.
Causes and indicators of segregation
People can live near others with similar backgrounds because of supportive networks, restricted choices, or both.
Residential segregation
The uneven spatial distribution of social groups between neighbourhoods within a wider area.
New migrants may seek relatives, familiar languages, trusted information and nearby employment. Existing networks reduce the cost and risk of finding work or accommodation. At the same time, low income, discrimination in housing, limited credit or a restricted supply of affordable homes can narrow choice. These mechanisms can reinforce clustering even when residents would prefer a wider choice. An affluent cluster and a low-income cluster may both be spatially segregated but have very different resources and degrees of freedom.
Compare a small-area map of ethnicity or country of birth with income, employment, qualifications, health and recorded crime, using compatible dates and boundaries. A correlation could reflect shared constraints such as housing costs, access to jobs and past planning. It does not show that ethnicity causes ill health or crime. The ecological fallacy is inferring an individual characteristic from an area average: a low-income ward contains residents at different incomes. Police recording and resident/daytime populations also affect crime comparisons.
Segregation is scale-dependent. A diverse borough can contain relatively homogeneous streets. Conversely, mixing within streets may coexist with separate friendship networks or unequal access to public space. Stratford’s new and established neighbourhoods offer a useful housing-tenure comparison, but census maps must be supplemented with affordability and lived experience. Amble can be less ethnically diverse while still containing differences by age, housing tenure and income. Diversity, equal opportunity and social contact are distinct questions.
Measuring diversity and spatial patterns
A diversity index summarizes the composition of an area but cannot by itself reveal where different groups live within it.
For an original illustrative population grouped into three consistent census-style categories with proportions 0.50, 0.30 and 0.20, use the Simpson form below. It measures the probability that two independent selections fall in different groups. This probability interpretation assumes sampling with replacement; do not mix it with the finite-population version.
Here is each group’s proportion of the total, between 0 and 1, and all proportions sum to 1.
The worked value is . A single-group population gives 0. With three equal groups the maximum is , not 1. An index near 1 requires many similarly sized groups. State the categories: changing their number or definition changes the index. Ethnic-group categories do not directly measure language, religion, individual identity or integration.
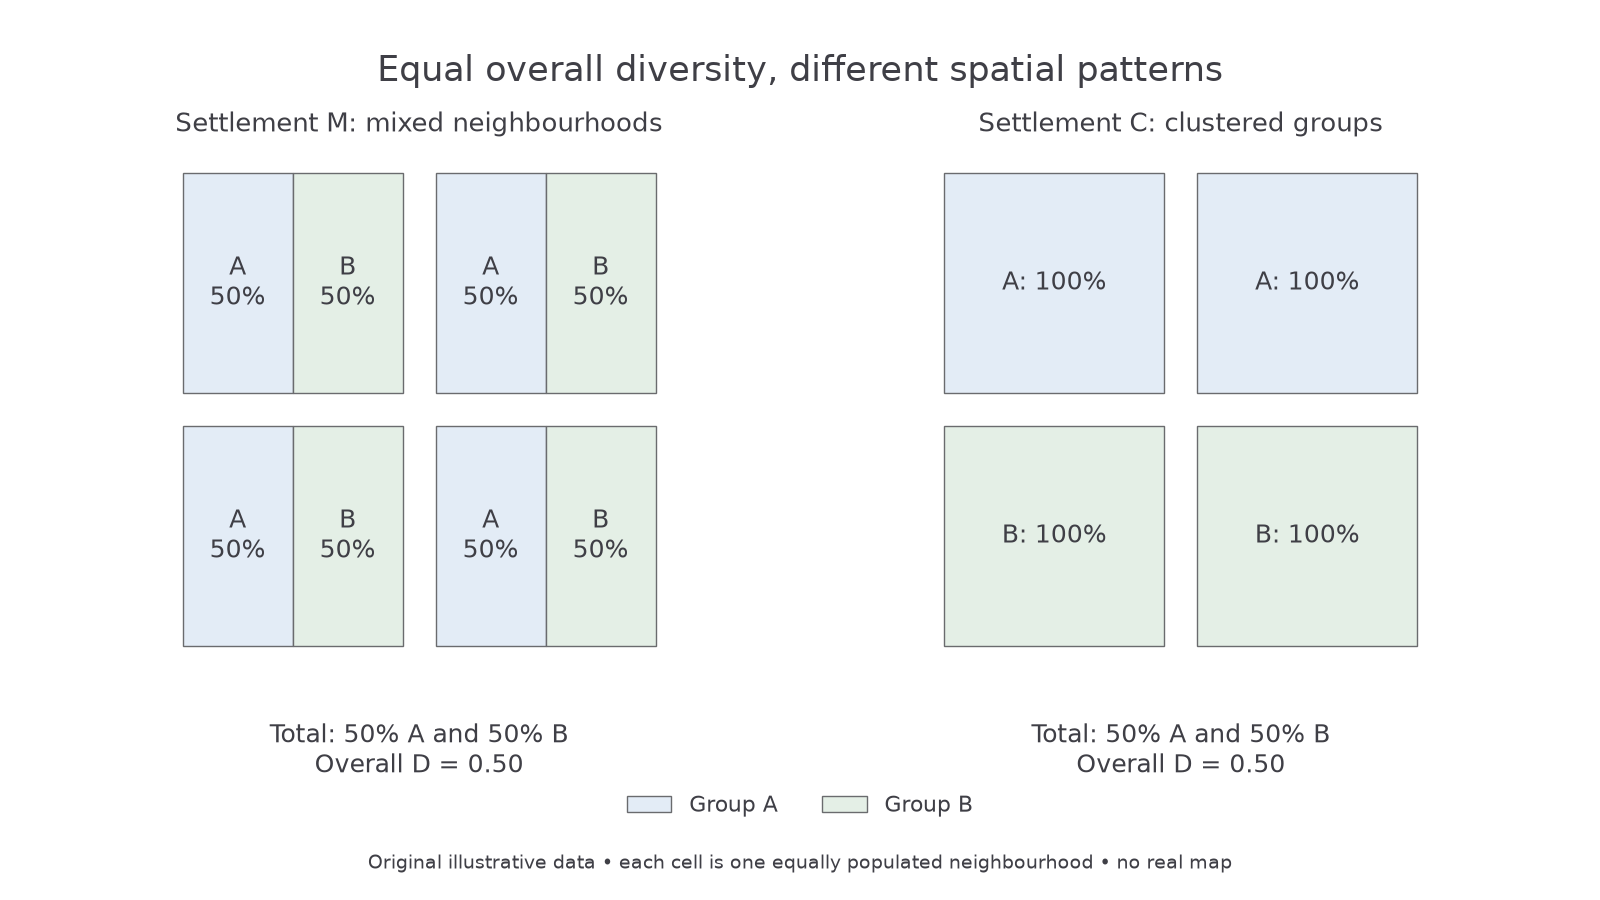
Original illustrative spatial data. Each cell represents one equally populated neighbourhood; shading shows two groups’ shares. No real street, boundary or community is represented.
In Settlement M every neighbourhood has 50% of each group. In Settlement C, two neighbourhoods contain only Group A and two only Group B. Both settlements therefore have overall , yet C is more segregated at neighbourhood scale. Mapping the same categories at a finer spatial scale supplies information that the aggregate index removes.
Continue this lesson.
You’re previewing NovaLearn without an account. Create a free account to read the rest.
Create free account