4A.10 - Measuring regeneration success
Learn to compare economic, social, demographic and environmental change, calculate meaningful differences, and distinguish improvement in a place from improvement for its existing residents.
Economic change and comparison
Economic regeneration should improve livelihoods, not simply create impressive buildings. Income, poverty and employment capture different dimensions. Use resident-based employment to investigate residents' opportunities; workplace-based job totals show jobs located in the area and can include commuters. Record whether income is individual or household, mean or median, before or after housing costs, and adjusted for inflation.
For a rate already expressed as a percentage, subtraction gives a change in percentage points. Dividing that difference by the old rate gives its relative percentage change.
The graph uses original illustrative figures for two areas, not observed Stratford or Amble data. Assume each area has a constant labour force of 1,000 people and unemployment has been measured in the same way in both years.
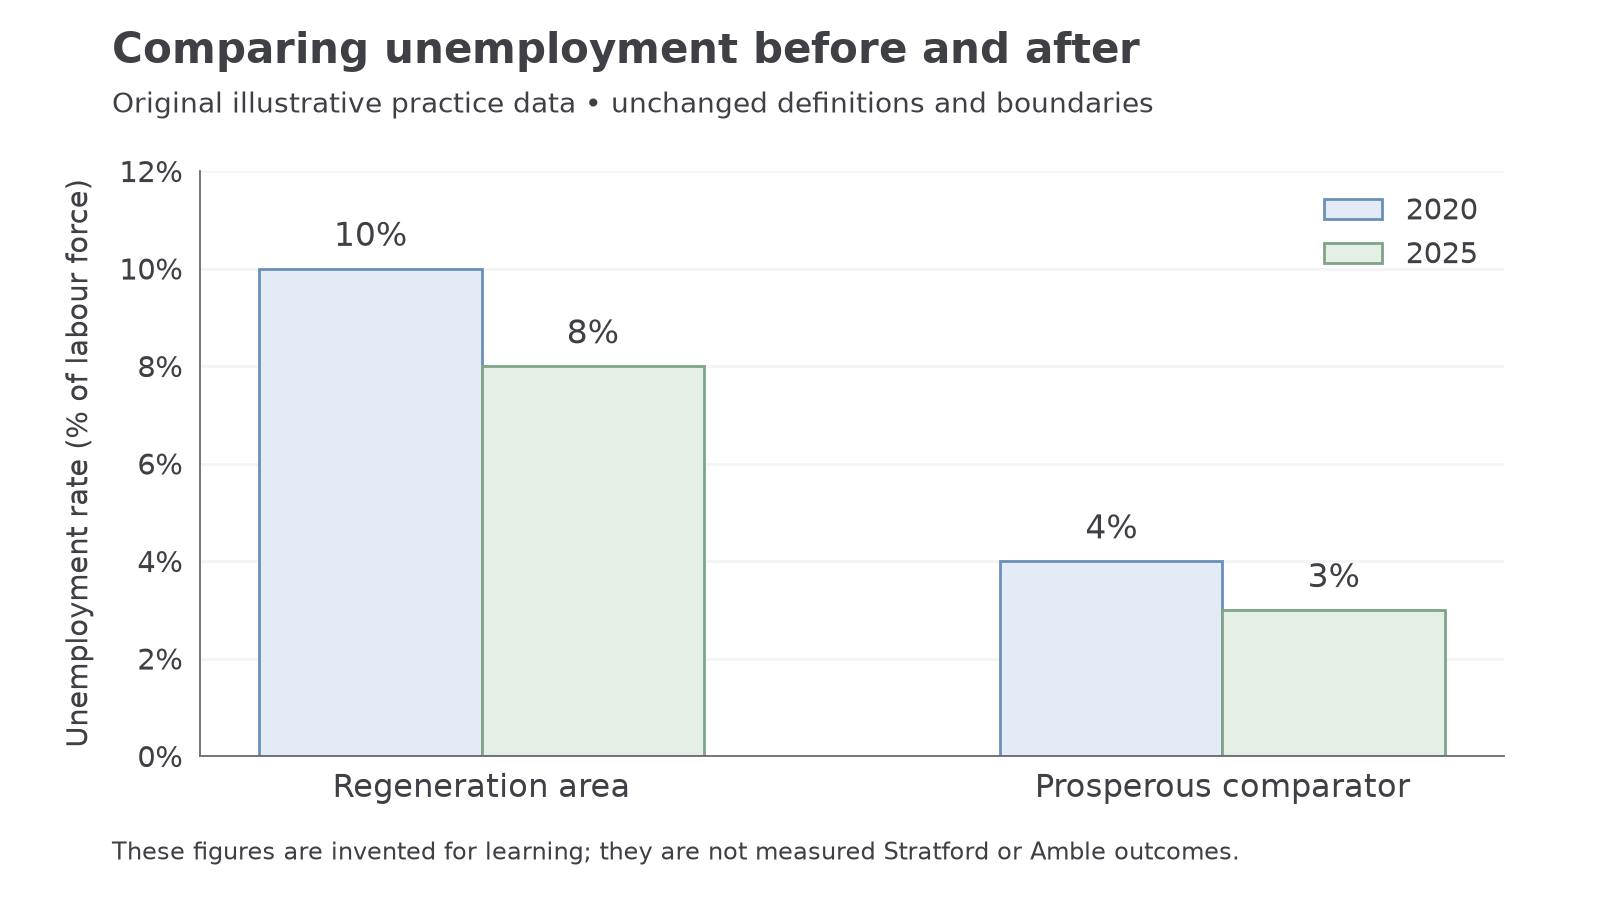
Original illustrative unemployment rates: regeneration area 10% to 8%; prosperous comparator 4% to 3%. These are practice data, not measured local outcomes.
In the regeneration area, unemployed people fall from 100 to 80: an absolute decrease of 20 people. The rate falls by 2 percentage points, but the relative fall is . The comparator's rate falls by 1 percentage point, or 25% relative to its lower starting value. Both improve. The between-area rate gap narrows from 6 to 5 percentage points, although the regeneration area's relative improvement is smaller. Specify which comparison supports your judgement.
Compare with a more successful area to examine convergence, while recognising different starting conditions. For causal evaluation, a similarly affected area without the intervention may be a more useful comparator. A prosperous place is not automatically a fair counterfactual. Poverty counts also need a consistent definition: absolute poverty uses a fixed real standard; relative poverty refers to position against an income distribution. National income changes can alter relative poverty without an equivalent change in local material conditions.
Social and demographic progress
An area's average can improve while inequalities within it remain unchanged or increase. Investigate housing security, access to services, health, education and opportunities across neighbourhoods and population groups. Life expectancy summarises mortality patterns; it is an estimate, not the lifespan every resident will reach. Health outcomes often respond slowly to housing, income and service improvements.
In an original illustrative comparison, real median household income rises from £20,000 to £24,000 in one neighbourhood and from £30,000 to £39,000 in another. Both become richer, but the income gap grows from £10,000 to £15,000. In another illustrative pair, life expectancy rises from 75 to 77 years and from 80 to 83 years: improvement occurs in both, yet the gap grows from 5 to 6 years. “Improvement” and “reduced inequality” are distinct claims.
Deprivation combines disadvantages rather than measuring income alone. England's Index of Multiple Deprivation (IMD) compares small areas using multiple domains. Inspect the relevant income, employment, health, education, housing/services and environmental evidence instead of using an overall rank as a complete explanation. A rank is relative position among areas, not a quantity of deprivation: moving 100 places does not mean a fixed percentage improvement. Versions, indicators and boundaries can change, so do not interpret ranks from different releases as a simple numerical trend. The 2025 official guidance explains these comparability limits.
Demographic change complicates evaluation. An influx of healthier or higher-income residents can improve averages even if original residents gain little; displacement can remove poorer households from the measured area. Population growth might indicate attraction, but can increase service pressure. Age structure also affects crude health comparisons. Follow comparable groups over time where lawful data permit, disaggregate by tenure or age, and compare both the place's population and existing residents' experiences.
Continue this lesson.
You’re previewing NovaLearn without an account. Create a free account to read the rest.
Create free account