4B.1 - Changing population structures
Learn how population size, density and age structure vary across the UK, and how births, deaths, migration, accessibility and planning create these differences.
Uneven regional change
A national increase can conceal very different regional histories.
Population structure describes the composition of a population, especially its age and sex distribution. Population density is the number of people per unit of land area. Neither is the same as population size or its rate of growth: a small rural settlement can grow quickly while remaining much less dense than a city.
The specification's roughly 50-year perspective requires a sequence, rather than the assumption that London always grew. Historical ONS estimates show London declining from about 7.53 million in 1971 to 6.77 million in 1986, then recovering to 7.51 million in 2006. The South East increased from about 6.83 to 8.24 million over 1971–2006, while the North East fell from about 2.68 to 2.56 million. These are dated mid-year estimates from one historical series, not today's population counts.
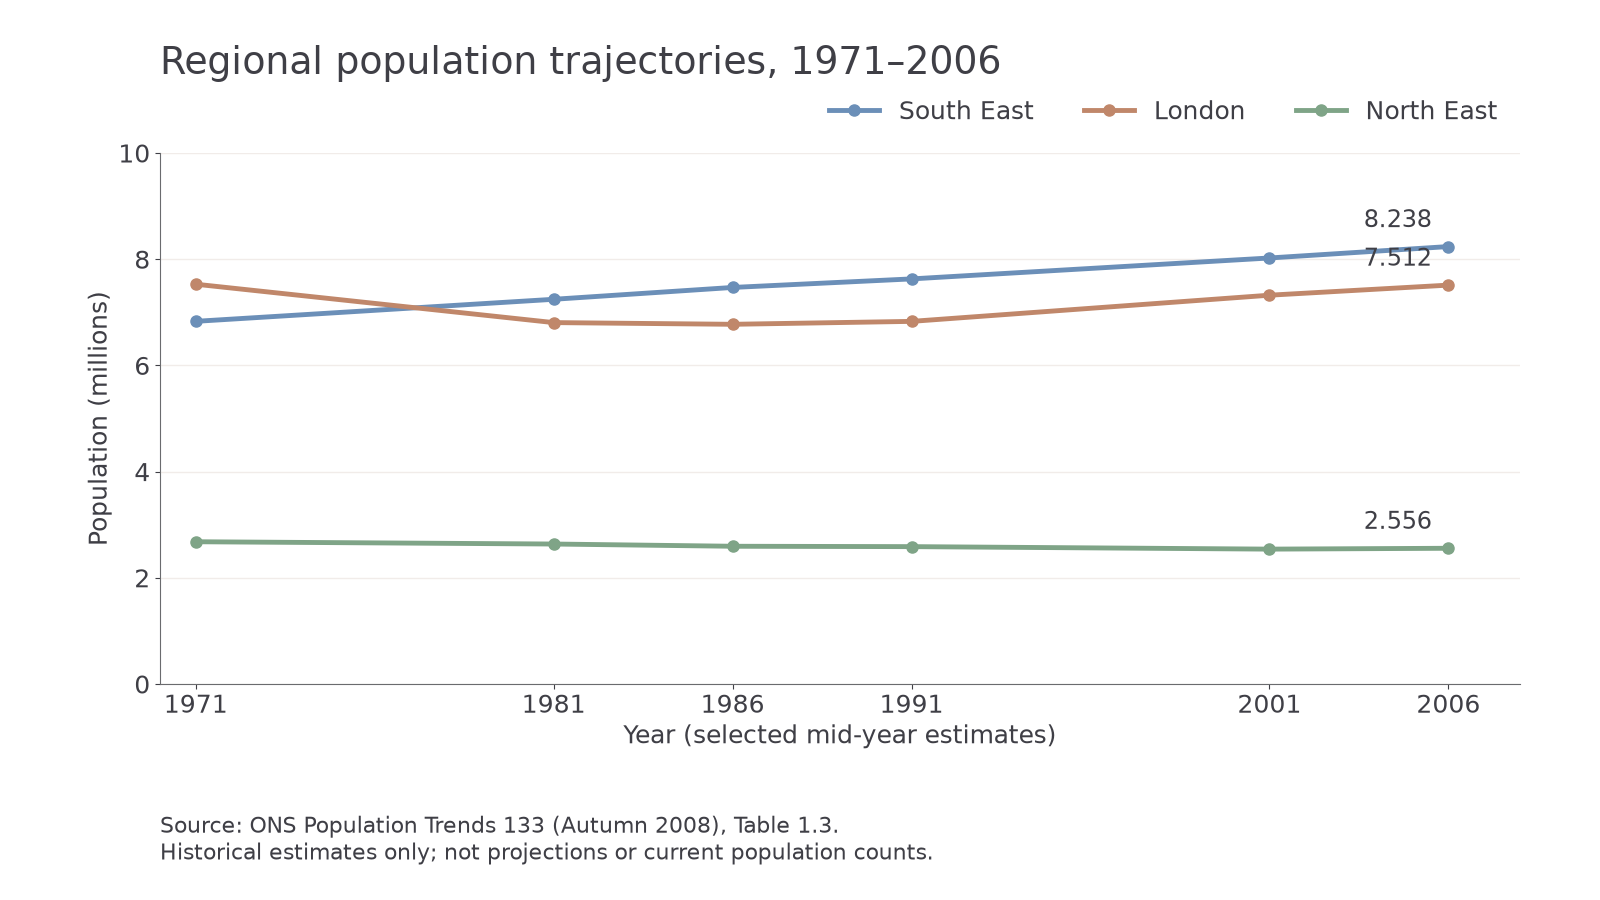
Original plot of ONS Population Trends 133, Table 1.3; population in millions. Selected historical estimates, not projections.
Later census evidence continues the broad contrast but also changes the ranking: between 2011 and 2021 London grew by 7.7%, the South East by 7.5%, and the North East by 1.9%; the East of England grew faster than all three. Do not join a historical estimate and a census count as if their methods were identical. Together they demonstrate uneven change over several decades, not a permanent regional growth law.
One explanation is changing employment geography. Loss of industrial jobs can encourage younger adults to leave; growth of services, universities and internationally connected work can attract them. Housing supply and costs may divert growth from a city to accessible surrounding settlements. These are mechanisms to investigate with employment and migration evidence: the graph alone does not prove their relative importance.
Sources: ONS historical regional estimates, Table 1.3, ONS London/North East Census 2021 context, ONS South East Census 2021 context.
The rural–urban continuum
Population patterns change along a continuum of settlement size, density and connections, rather than at one sharp urban–rural boundary.
Rural–urban continuum
A range from densely built, well-connected urban places through suburbs and commuter settlements to sparsely populated, more remote rural areas.
A central city provides concentrated jobs, transport and services, making dense housing viable. A commuter village can remain visually rural while its residents depend on urban workplaces. A remote village may have fewer daily connections and a smaller labour market. Accessibility means the ease of reaching opportunities; travel time, cost, reliability and disability access matter as well as distance.
Four influences interact. Physical factors such as steep relief, exposed coasts or flood risk can restrict developable land. Historical industry and transport leave housing, routes and brownfield land that continue to shape settlement. Accessibility changes demand: a new rail service may attract commuters and young adults. Planning determines where housing is permitted, its density and tenure; protected land may constrain expansion, while brownfield redevelopment may add apartments near a station.
Stratford in east London illustrates the interaction: its railway history and present transport connections support dense urban development. Amble is a coastal town within Northumberland's wider rural setting, not an empty countryside or a remote village. Harbour functions, coastal land and road connections give it a different settlement history. These are contrasting worked examples; investigate travel times and the actual study boundary before claiming a precise continuum position for your own places.
Age structure is also selective. Accessible flats may attract students or working-age adults; a commuter settlement may attract families able to afford housing and travel; a retirement destination may attract older adults. These are possible patterns, not inevitable properties of every settlement.
Continue this lesson.
You’re previewing NovaLearn without an account. Create a free account to read the rest.
Create free account