4A.6 - Evidence of the need for regeneration
Learn to combine statistics, relationships between indicators and contrasting media to judge a place's regeneration needs. Use worked illustrative evidence to practise the method, then apply it to your real locality without confusing a representation with a complete account.
Statistical evidence and need
Statistics help identify which disadvantages are concentrated in a place and which groups or neighbourhoods face them.
Start with an explicit question, such as whether unemployment, housing affordability or poor living conditions make regeneration necessary. Select indicators that test it: secure employment, income deprivation, rent relative to income, health, educational outcomes, crime, service access and land condition. State dates, units and populations. A vacancy percentage describes empty properties; it does not explain why they are empty or whether their reuse meets residents' needs.
Compare your real local place with a suitable benchmark and contrasting place using compatible definitions and boundaries. Use small-area variation as well as the average. Census employment measures from a pandemic period, sample surveys and administrative records have different coverage and uncertainty. More recent data may use a changed definition. A programme's announced jobs and its verified jobs held by local residents are different measures.
An original illustrative area has 12% unemployment compared with 5% in its benchmark: the difference is 7 percentage points, while its rate is higher. These are two descriptions of the same contrast. Neither shows why unemployment differs. Examine training access, transport and job availability before selecting an intervention.
Use the English IMD2025 database to locate overall and domain-level relative disadvantage where your locality is in England; use the appropriate national measure elsewhere. Do not compare different UK national indices as though they were one ranking. A favourable average does not remove pockets of need. A low rank is a prompt to identify the type and people affected, not a complete regeneration plan.
Scatter graphs and rank correlation
A relationship between indicators can support an explanation of need, but correlation does not establish a cause.
Plot paired observations on a scatter graph, with the proposed explanatory variable on the horizontal axis and the response variable on the vertical axis. Label units, use consistent spatial units and inspect direction, strength, unusual points and any non-linear pattern. Do not join the points as a time series. Graph construction is a practical skill to carry out; a written interpretation does not certify accurate plotting.
The following original illustrative data represent six unnamed neighbourhoods, not measured Stratford or Amble observations.
| Neighbourhood | Income-deprived population (%) | Vacant properties (%) | Income rank | Vacancy rank | Rank difference | |
|---|---|---|---|---|---|---|
| A | 10 | 2 | 1 | 1 | 0 | 0 |
| B | 15 | 4 | 2 | 3 | −1 | 1 |
| C | 20 | 3 | 3 | 2 | 1 | 1 |
| D | 25 | 6 | 4 | 5 | −1 | 1 |
| E | 30 | 5 | 5 | 4 | 1 | 1 |
| F | 35 | 8 | 6 | 6 | 0 | 0 |
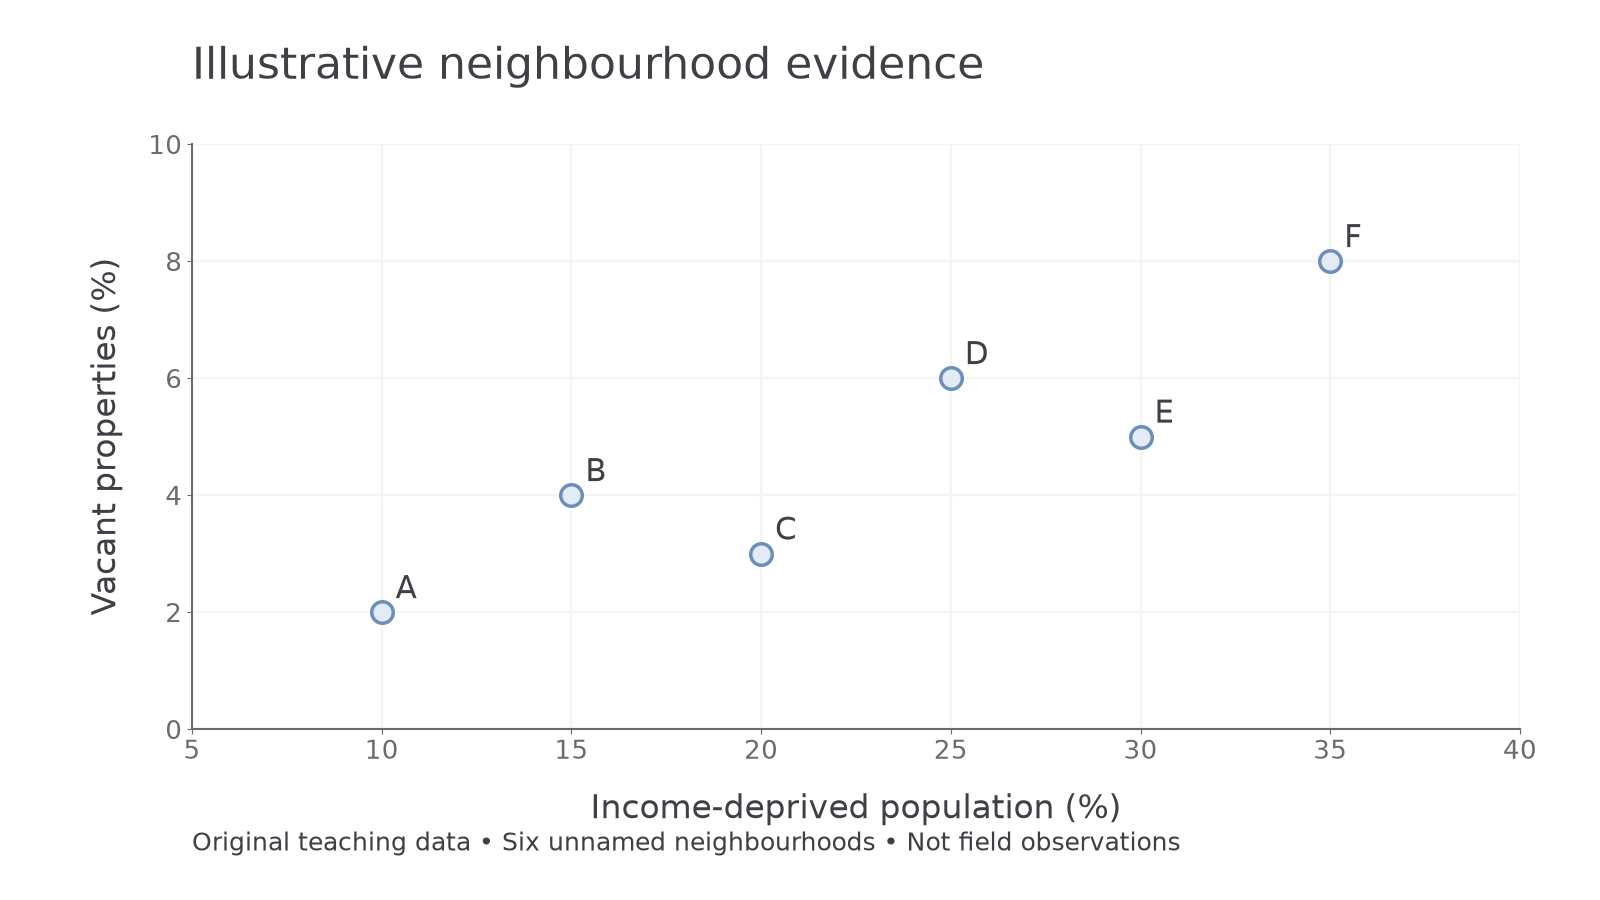
Original illustrative data: the pattern is broadly positive, with B/C and D/E departing from a perfect ordering.
Spearman's rank correlation summarises the strength and direction of a monotonic relationship: values tend to rise or fall together. Rank both variables in the same direction, retaining paired rows; calculate each difference, square it and sum the squares. If values tie, assign their average rank. The simple formula below is used for this untied example; ties require the appropriate correction or a verified rank-correlation method rather than pretending the untied formula is exact.
Here is the difference between each pair of ranks and the number of paired observations. For the table, and , so , approximately 0.89.
Continue this lesson.
You’re previewing NovaLearn without an account. Create a free account to read the rest.
Create free account