5.19P - Surface radiation core practical
Investigate how different surfaces change hot-water cooling, using fair controls, repeated runs and careful interpretation of temperature data.
What the practical investigates
All surfaces emit and absorb electromagnetic radiation. At the temperatures used in this practical, most of the thermal radiation is infrared. The waves transfer energy; they do not carry matter away from the container overall.
The standard comparison is between surfaces such as matt black and shiny silver. Under the same conditions, a dull black surface is usually a better emitter and absorber of thermal radiation, while a shiny silver surface is usually a poorer emitter and absorber and a better reflector.
That statement must be tested fairly. A hotter surface emits more radiation than a cooler surface, and a larger container has more radiating area than a smaller one. The containers therefore need to be identical apart from the surface being investigated, and their water must begin at the same temperature.
The Pearson cooling method asks:
How does the nature of a container's outer surface affect the temperature fall of a fixed volume of hot water over time?
Temperature falls because energy is transferred to the surroundings by radiation, conduction and convection, with possible evaporation from exposed water. This practical does not directly separate those transfers. Instead, identical containers and lids keep the unwanted differences as small as possible, so a difference in cooling is more confidently linked to the outer surface.
A faster temperature fall is evidence of greater thermal emission only when starting temperature, water amount, container geometry, lid and surroundings are controlled.
Apparatus and variables
Use at least four identical metal beakers, cans or test tubes whose outer surfaces are different. Suitable examples are matt black, matt white, shiny black and shiny silver. Thin paint or foil coverings should cover the same external area; thick insulating wraps would change more than the surface.
[DIAGRAM: asset_name: 21_1PH0-P1-05E_5.19P - Surface radiation core practical - diagram 01; asset_slug: 21_1ph0-p1-05e_5-19p-surface-radiation-core-practical_diagram_01; recommended_method: image_gen; description: wide monochrome practical arrangement of four identical lidded metal containers with different labelled surfaces, equal water levels, temperature probes at equal depths, measuring cylinder, stopwatch and heatproof mat]
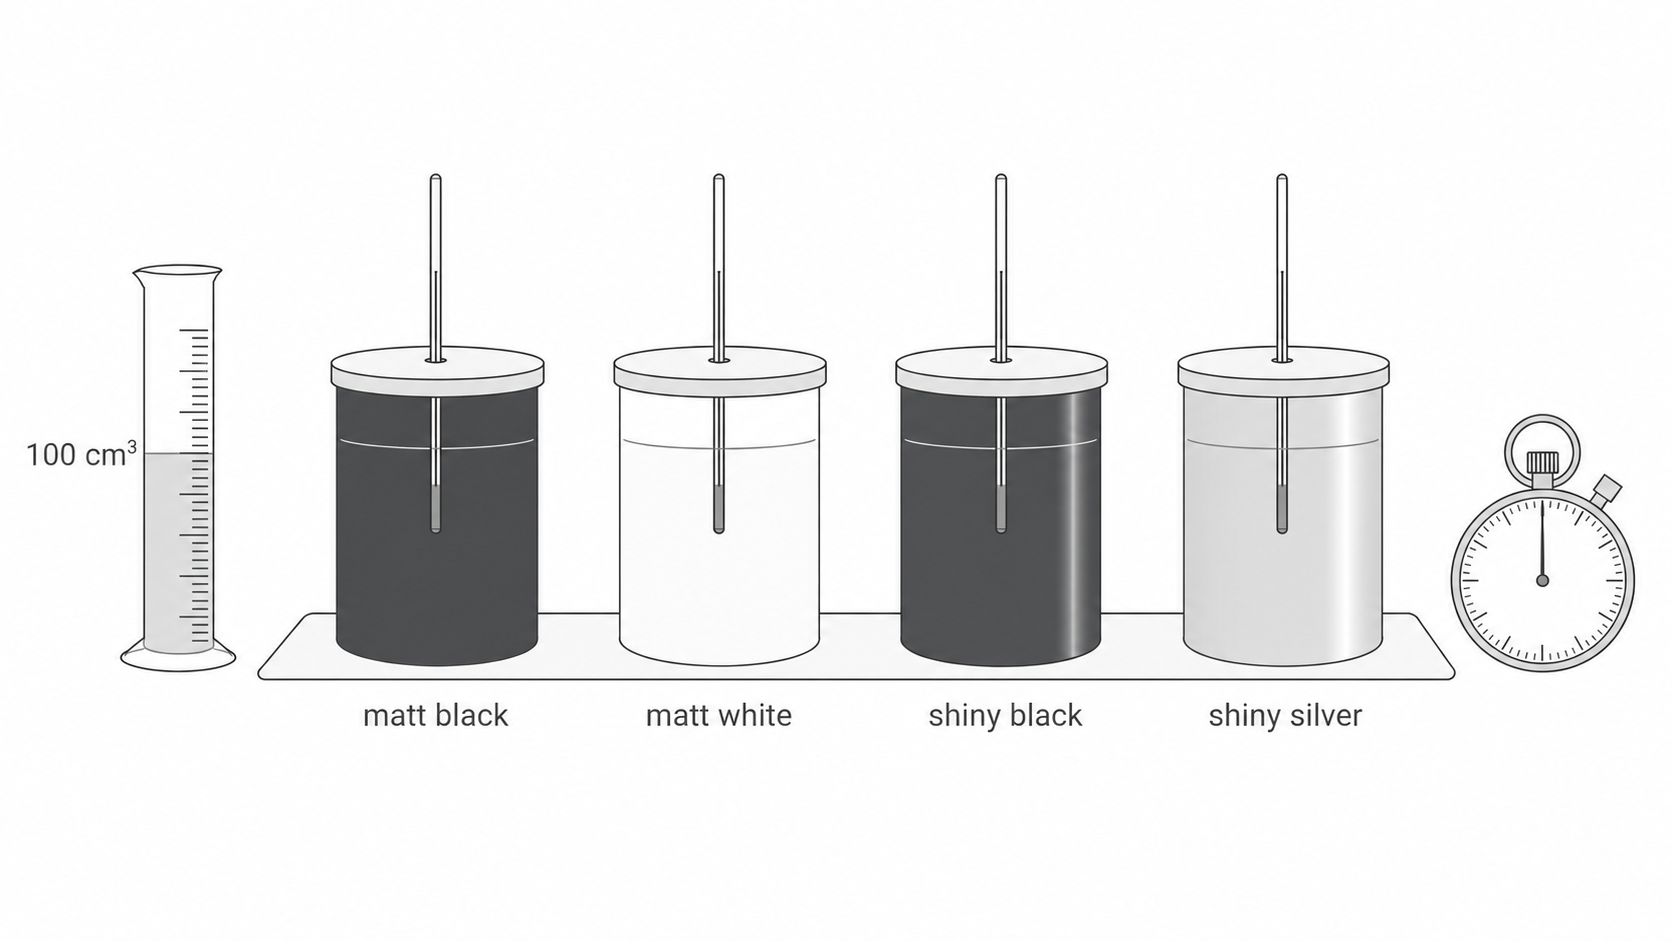
The full apparatus is:
- at least four identical containers with different outer surfaces;
- one close-fitting lid with a probe hole for each container;
- four thermometers or temperature probes connected to a datalogger;
- a measuring cylinder;
- a large stirred supply of hot water;
- a stopwatch if the logger does not record time automatically;
- heatproof mats and paper towels for spills.
| Variable role | Quantity | How it is handled |
|---|---|---|
| Independent | Nature of the outer surface | Use at least four named surfaces, each covering the same area of an otherwise identical container. |
| Dependent | Water temperature at fixed times | Record in degrees Celsius; compare the temperature drop or cooling rate over the same interval. |
| Controlled | Volume of water | Measure the same volume into every container using the measuring cylinder. |
| Controlled | Initial water temperature | Use one well-stirred hot-water supply and start the comparison when readings are the same within the thermometer resolution. |
| Controlled | Container and lid | Use the same material, dimensions, exposed area and lid design for every surface. |
| Controlled | Measurement and surroundings | Keep probe depth, reading times, container spacing, bench position and room conditions the same. |
Carry out the cooling investigation
- Put the four identical containers on heatproof mats, away from direct sunlight, radiators and draughts. Space them equally so that one does not shield or warm another.
- Measure the same volume of water, for example , into each container from one well-stirred hot-water supply. Pour carefully and work promptly so the starting temperatures remain close.
- Fit identical lids and place a thermometer or temperature probe through each lid. Keep every sensing tip at the same depth in the water and away from the metal wall and base.
- Check and record the initial temperature of each container. Start from a common measured initial temperature within the instrument resolution. If sequential pouring gives unequal initial temperatures, repeat with a better pouring procedure; do not simply wait and assume all cans will reach the same temperature together. A datalogger can start all four channels together.
- Record every temperature at fixed intervals, for example every minute for ten minutes. Keep the lids in place between readings and do not move the containers.
- Repeat the entire experiment at least twice more with fresh water at the same initial temperature. Rotate the surfaces between bench positions on later runs, then calculate the mean temperature for each surface at every time.
The repeated quantity is the whole cooling run, not several quick readings of the same unchanged water. Independent runs show how much the result varies when the setup and pouring are repeated. Means reduce the effect of random variation when the repeat curves are reasonably close.
The main hazard is hot water, which can scald. Use hot rather than actively boiling water, keep containers away from the bench edge, pour at bench height over a heatproof mat and clear spills immediately. Use protected or digital probes where possible; if glass thermometers are used, handle them carefully and follow the laboratory procedure for breakage. Keep the datalogger and electrical leads away from wet areas.
Process the cooling data
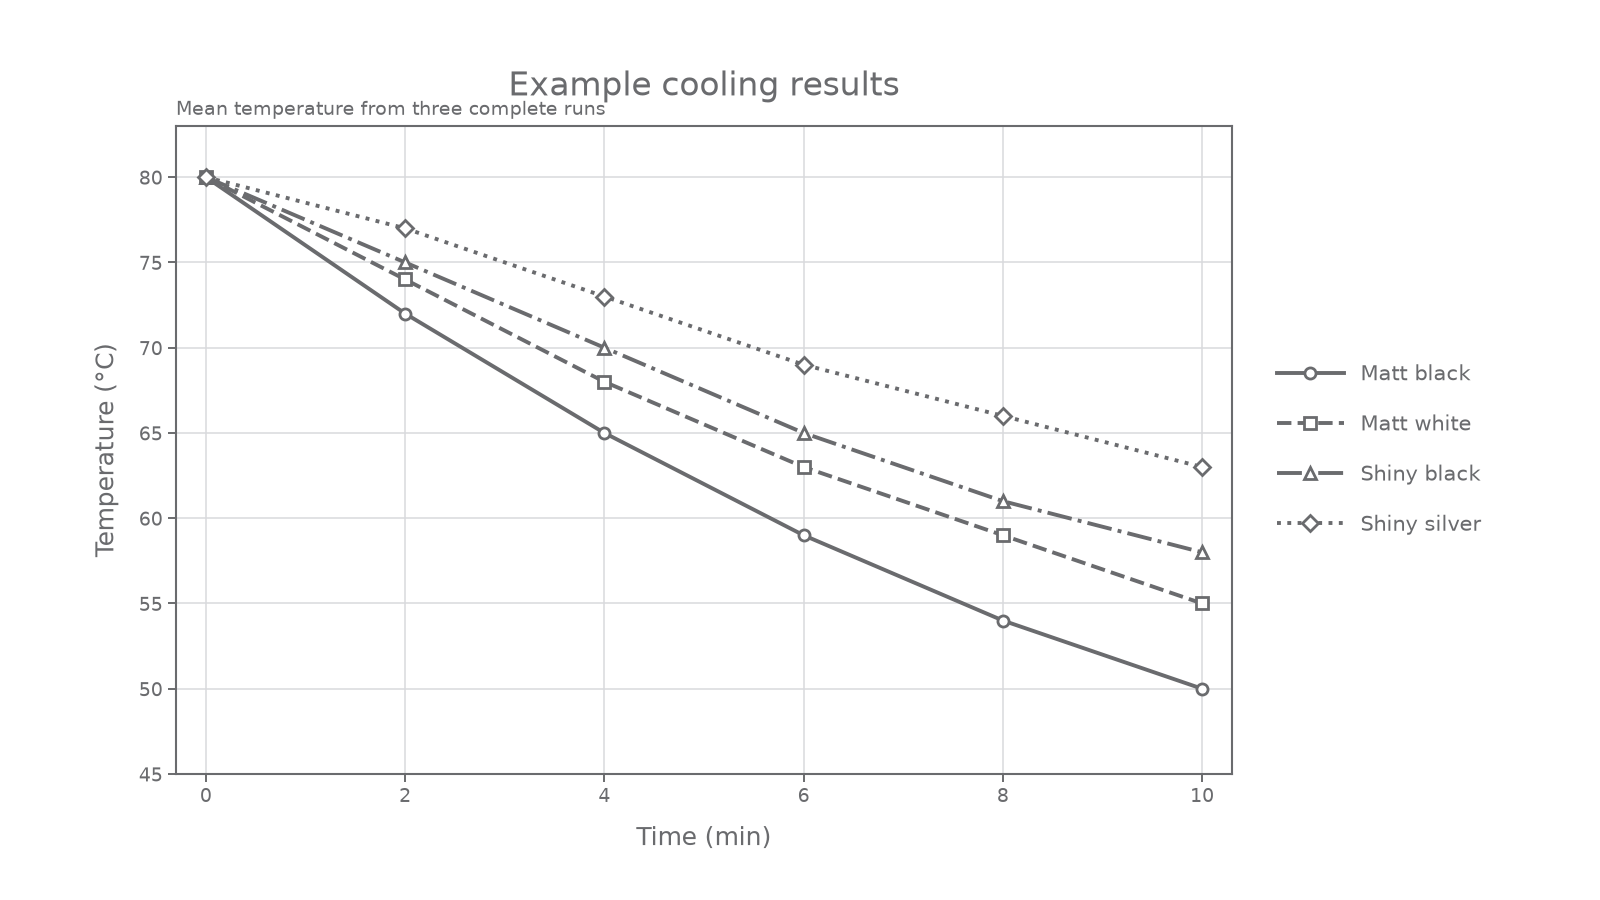
Record raw readings with units before calculating means. The following original example shows mean temperatures from three complete runs. It illustrates a possible pattern; actual values and the order of the two middle surfaces depend on the coatings used.
| Time (min) | Matt black temperature (degrees C) | Matt white temperature (degrees C) | Shiny black temperature (degrees C) | Shiny silver temperature (degrees C) |
|---|---|---|---|---|
| 0 | 80 | 80 | 80 | 80 |
| 2 | 72 | 74 | 75 | 77 |
| 4 | 65 | 68 | 70 | 73 |
| 6 | 59 | 63 | 65 | 69 |
| 8 | 54 | 59 | 61 | 66 |
| 10 | 50 | 55 | 58 | 63 |
[DIAGRAM: asset_name: 21_1PH0-P1-05E_5.19P - Surface radiation core practical - diagram 02; asset_slug: 21_1ph0-p1-05e_5-19p-surface-radiation-core-practical_diagram_02; recommended_method: matplotlib; description: exact temperature-time graph of the original four-surface cooling data with labelled axes and units, distinct monochrome line styles, point markers and a clear legend]
Continue this lesson.
You’re previewing NovaLearn without an account. Create a free account to read the rest.
Create free account