S2 - Tables, charts and time-series data
The same counts can look very different in different displays. Learn to organise one-way and two-way tables, choose and construct charts for categories, discrete values and time series, and preserve the meaning of the original data when plotting.
Data types and frequency tables
Forty pupils report how they travel: 20 walk, 12 take a bus and 8 cycle. Should you join these three counts with a line? The answer depends on what the horizontal labels mean.
You already know
A frequency is a count. The frequencies of separate categories add to the total number of observations: .
Travel method is a category, not a numerical measurement. Number of pets is a count with separate possible values. Journey time is a measurement that can take intermediate values.
Types of data
Categorical data classify observations, such as travel method. Discrete numerical data take separate values, often counts. Continuous numerical data can take any value in an interval, such as measured time. Rounding a time does not change the underlying variable into a count.
A frequency table lists each category, value or class with its count. Tally each observation once before adding the frequencies.
Worked example 1: organising categories
Question. Make a frequency table for 20 walking, 12 bus and 8 cycle journeys.
Plan. Give each category one row, then check the total.
| Method | Frequency |
|---|---|
| Walking | 20 |
| Bus | 12 |
| Cycle | 8 |
| Total | 40 |
Why this layout? The category names distinguish the groups; the numbers count pupils, not kinds of transport.
Answer. The table above records all 40 journeys.
Check. Every journey belongs to exactly one listed category.
The next example changes only the walking frequency. The total must change with it.
Worked example 2: updating one category
Question. A second count has 24 walking, 12 bus and 8 cycle journeys. Make its frequency table.
Plan. Update walking, retain the other rows and recalculate the total.
| Method | Frequency |
|---|---|
| Walking | 24 |
| Bus | 12 |
| Cycle | 8 |
| Total | 44 |
Why this step? The previous total 40 belongs to a different set of counts.
Answer. There are 44 journeys in the second table.
Check. Four extra walkers increase the total by four.
For measured data, a class must tell you where its endpoints belong. Here is how to avoid double-counting boundaries.
Worked example 3: grouping measurements
Question. Group times 6, 10, 12, 17, 20 and 23 minutes into , and .
Plan. Test each time against the class inequalities.
Why this step? A time of 10 satisfies the first class, but fails in the second.
Answer. The class frequencies are 2, 3 and 1.
Check. , so all six times appear once.
Use classes with no unintended gaps or overlaps. Later, unequal-width numerical classes will need special care when drawn.
Watch out
Wrong: put 10 in both and . The second class excludes 10. Read the inequality signs and assign each observation once.
Try a new table and classify the underlying variable.
Completing and interpreting two-way tables
A two-way table records two characteristics together, so each inside cell is an intersection of a row and a column.
For a club survey, rows might be junior and adult; columns might be morning and evening attendance. Each person must fit exactly one row and one column. Row totals count all people in that row; column totals count all people in that column. The bottom-right grand total counts every person once.
Worked example 4: finding missing cells
Question. There are 30 juniors and 20 adults. Twelve juniors and 7 adults attend in the morning. Complete the attendance table.
Plan. Subtract morning counts from row totals, then add columns.
Why this step? A row total already includes both time categories, so subtract to find the missing one.
Answer.
| Member | Morning | Evening | Total |
|---|---|---|---|
| Junior | 12 | 18 | 30 |
| Adult | 7 | 13 | 20 |
| Total | 19 | 31 | 50 |
Check. .
The next example changes only the adult morning count. Follow its effect along both its row and its column.
Worked example 5: updating one joint count
Question. Keep 30 juniors, 20 adults and 12 junior morning attendees, but change adult morning attendance to 9. Complete the table.
Plan. Recalculate the affected cells and totals.
Why this step? Two more morning adults mean two fewer evening adults when the adult total stays 20.
Answer.
| Member | Morning | Evening | Total |
|---|---|---|---|
| Junior | 12 | 18 | 30 |
| Adult | 9 | 11 | 20 |
| Total | 21 | 29 | 50 |
Check. Both routes to the grand total still give 50.
Read an inside cell using both headings: 11 means adult evening attendees, not all adults or all evening attendees.
Watch out
Wrong: add row totals 30 and 20 to column totals 21 and 29 and report 100 members. That counts everyone twice. Either row totals or column totals give the grand total, 50.
Now change only one of the joint counts again.
Bar charts and pictograms
A bar chart uses bar heights to compare category frequencies; a pictogram uses repeated symbols and a key.
Draw category bars at a consistent width with gaps, a labelled category axis and a regular frequency axis beginning at zero. A dual bar chart also needs a key identifying its two groups. In a pictogram, the key tells you what both full and partial symbols mean.
Worked example 6: two displays of the same counts
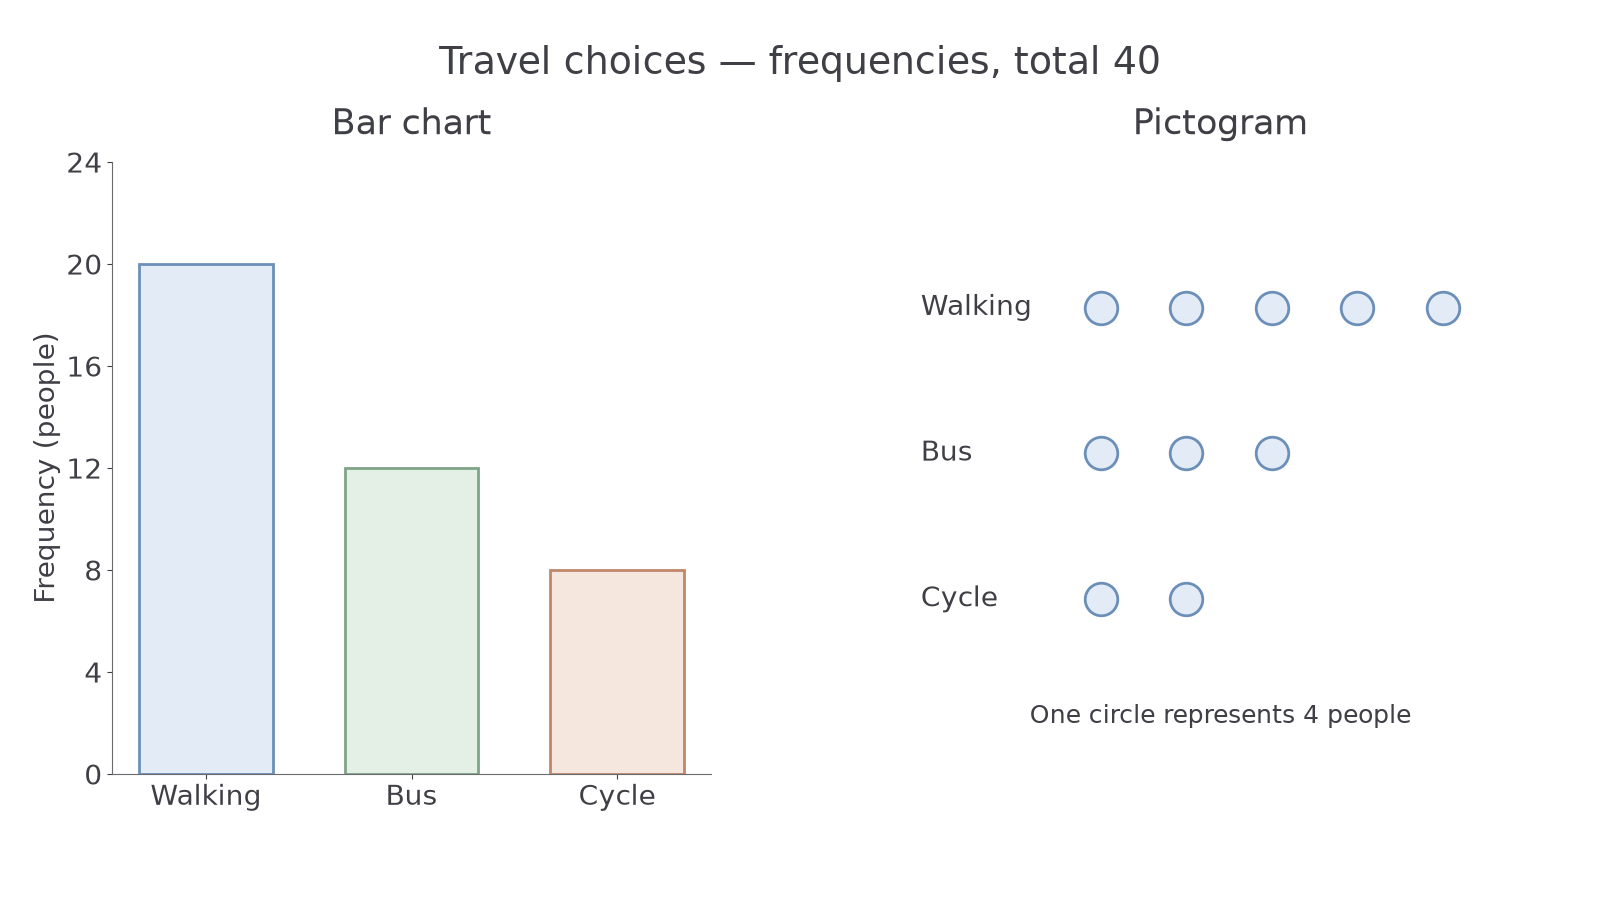
Question. Display walking 20, bus 12 and cycle 8 as a bar chart and a pictogram with one circle for four people.
Plan. Use the frequencies as bar heights and divide each by the pictogram key.
Why this step? Symbol count and person count differ because each circle stands for four people.
Answer. Draw separated bars at 20, 12 and 8; draw five, three and two circles in the corresponding pictogram rows.
Check. The ten circles represent people, matching the bar total.
[DIAGRAM: asset_name: Two displays of travel frequencies; asset_slug: 1ma1_m69_bar_pictogram; caption: Both displays show the same counts; the pictogram key assigns four people to one complete symbol.; description: Side-by-side displays for walking 20, bus 12 and cycle 8: a zero-based bar chart and a pictogram with five, three and two equal symbols respectively; each full symbol represents four people.]
The next example changes only the pictogram key. The underlying frequencies and bar chart stay unchanged.
Worked example 7: changing the symbol key
Question. Display those same 20, 12 and 8 people with one circle for eight people.
Plan. Divide every frequency by the new key.
Why this step? Doubling the key value halves the number of symbols, while preserving the counts.
Answer. Use 2.5, 1.5 and 1 circles, with the new key visible.
Check. .
For another key, one symbol for four tickets, 10 tickets require symbols. Three full symbols and a quarter represent tickets. Always read the stated key.
Watch out
Wrong: “A half symbol means half a person.” It means half the key value: with one symbol for six people, a half means three people. Also read a bar chart's baseline; starting at 80 can make frequencies 100 and 120 look twice as tall, although .
The next pictogram uses another key.
Proportional sectors in pie charts
A complete circle represents the whole group, so a category's fraction of the total equals its fraction of a full turn.
Pie-chart sector angle
Not on the formula sheet: derive it from the category's fraction of a full turn.
Use a protractor: draw a starting radius, measure each sector in turn, then label categories or supply a key.
Worked example 8: constructing sectors
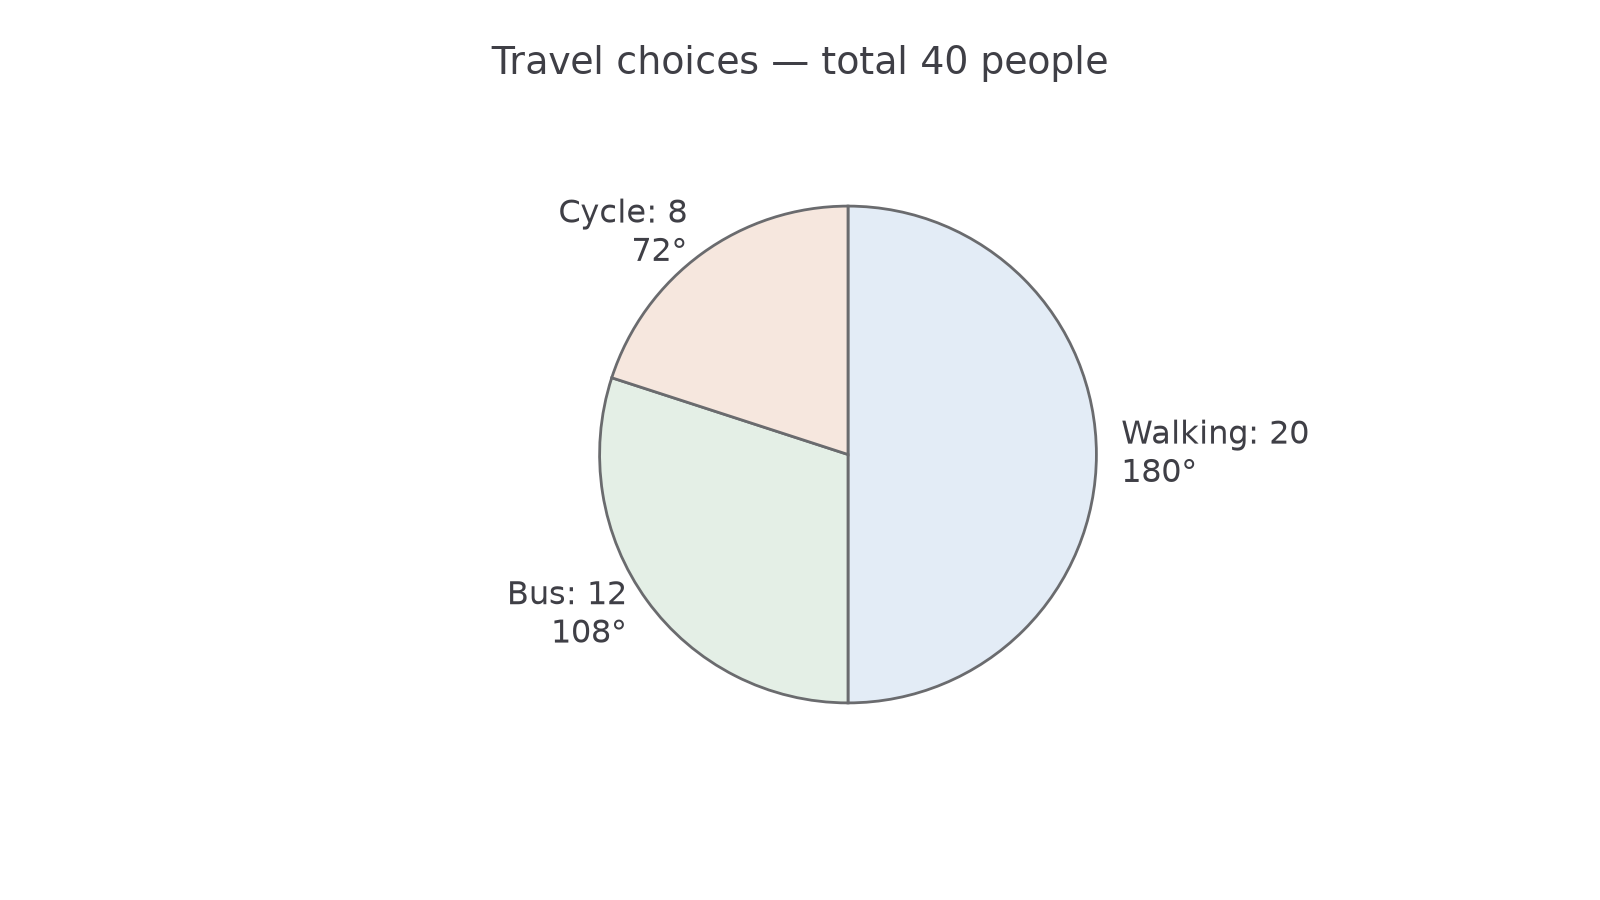
Question. Construct a pie chart for walking 20, bus 12 and cycle 8, total 40.
Plan. Convert each fraction into an angle.
Why this step? All three fractions use the same total because they share one whole circle.
Answer. Draw and label sectors of , and .
Check. .
[DIAGRAM: asset_name: Travel shares in a pie chart; asset_slug: 1ma1_m69_pie; caption: Sector angles represent each category's share of the forty-person total.; description: Pie chart with walking 20 at 180 degrees, bus 12 at 108 degrees and cycle 8 at 72 degrees; total 40 people.]
The next example reverses the direction: the same total and an angle are known, and the count is missing.
Worked example 9: recovering the count
Question. A pie chart represents 40 people. Find the count in a sector.
Plan. Find the fraction of a turn and apply it to 40.
Why this step? An angle gives a proportion; the population total converts it into a count.
Answer. 12 people.
Check. .
For a different total of 80, a sector gives people. Equal angles in equal-sized drawn circles can therefore represent different counts if their totals differ.
Watch out
Wrong: “A sector always contains 90 people.” It is one quarter of the total, so it represents 20 out of 80 people. Read the total and avoid rounding angles early enough to lose the full turn.
Use the same proportional relationship in both directions.
Vertical line charts for discrete values
A vertical line chart puts separate numerical values on a numerical axis and draws a line up to each frequency.
Unlike category names, numerical distances matter: 3 pets must be one step after 2 pets, even if nobody has 2 pets. Do not join the tops to suggest intermediate counts were observed.
Worked example 10: displaying pet counts
Question. Draw a vertical line chart for pet counts 0, 1, 2 and 3 with frequencies 3, 8, 6 and 3. Find the sample size and most frequent value.
Plan. Plot frequency at each equally spaced numerical position.
Why this step? The horizontal value identifies the count of pets; the vertical height tells how many people have it.
Answer. Draw the four unjoined lines on labelled pet-count and frequency axes; 20 people, most commonly 1 pet.
Check. The four heights sum to 20.
Continue this lesson.
You’re previewing NovaLearn without an account. Create a free account to read the rest.
Create free account