A8, A9, A10 - Coordinates, straight lines and gradients
Coordinates place points precisely (A8). You will use straight-line equations to plot and find lines (A9), then read and interpret their gradients and intercepts (A10), including how to recognise parallel lines.
Coordinates in all four quadrants
Two delivery plans cost and pounds for distance kilometres. Can extra distance ever close their £6 gap? Their graphs will answer this, once we can describe points and lines precisely.
You already know
A negative number lies left of zero on a horizontal number line. Coordinates extend this idea in two directions: horizontal position and vertical position.
The horizontal -axis and vertical -axis meet at the origin, . Positive goes right; positive goes up. Negative values go the opposite way.
Coordinates and quadrants
The coordinates give horizontal position first and vertical position second. The axes divide the plane into four quadrants, numbered anticlockwise from the top right. Points on either axis lie in no quadrant.
The signs tell you which quadrant contains a point.
| Quadrant | Sign of | Sign of | Example |
|---|---|---|---|
| I | Positive | Positive | |
| II | Negative | Positive | |
| III | Negative | Negative | |
| IV | Positive | Negative |
[DIAGRAM: asset_name: Coordinates in all four quadrants; asset_slug: 1ma1_m21_coordinates; caption: Coordinates use horizontal position first, then vertical position.; description: Labelled axes show points (3,2), (-3,2), (-3,-2) and (3,-2) in the four quadrants, with guides to the axes and quadrant labels I to IV.]
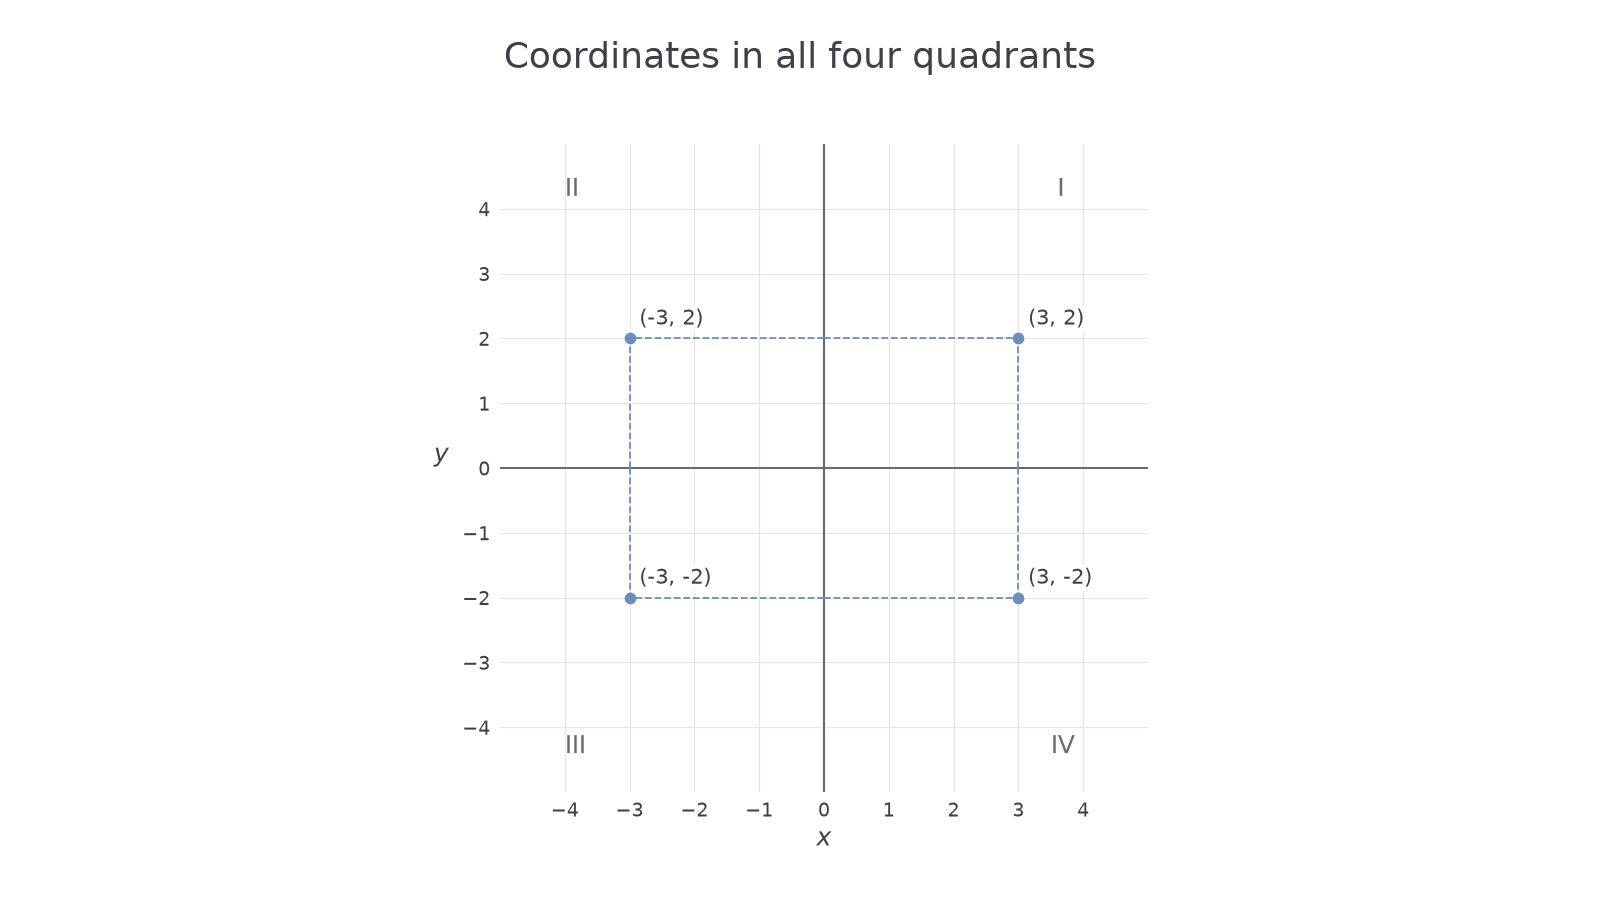
Use the axes' numerical scale rather than counting squares without checking their value.
Worked example 1: a point above the horizontal axis
Question. A point is three units left and two units up from the origin. Write its coordinates and state its quadrant.
Plan. Assign signs to the horizontal and vertical movements, in that order.
Why keep this order? would describe right and down, a different point.
Answer. , in quadrant II.
Check. Its signs are negative, positive, matching the top-left quadrant in the diagram.
Change only the vertical direction: two units down instead of up.
Worked example 2: a point below the horizontal axis
Question. A point is three units left and two units down from the origin. Write its coordinates and state its quadrant.
Plan. Keep the horizontal coordinate and change the vertical sign.
Why change only the second sign? Only the vertical position changed.
Answer. , in quadrant III.
Check. It is directly below the point in example 1 and remains left of the vertical axis.
A point on the -axis has , such as ; a point on the -axis has , such as . If each large square represents two units, is three large squares right of the origin. To plot accurately, label regular scales and mark the point at the intersection of its horizontal and vertical positions.
Watch out
Wrong: read as two left and three down. Right: the first number belongs to the horizontal axis, so move three left and two down.
Change the distances for the same kind of coordinate decision.
Plotting a line from its equation
A graph of an equation contains all coordinate pairs that make the equation true.
Make the subject if necessary, choose inputs, calculate outputs and plot the resulting points. For a straight line, use a ruler. A useful surprise is that just two distinct points determine the whole line, containing infinitely many points; a third point checks your arithmetic.
Worked example 3: plotting a falling line
Question. Plot for .
Plan. Rearrange, calculate five points and join them with a ruled line.
Why calculate extra points? Two fix the line, but additional points reveal a substitution or plotting error.
Answer. Plot , then rule the straight line through them over the requested range.
Check. The last point satisfies the original equation: .
The diagram shows the constructed line. On squared paper, label an -scale from to and a -scale from to ; plot the points before placing your ruler.
[DIAGRAM: asset_name: Points on a straight-line equation; asset_slug: 1ma1_m21_line; caption: Every plotted point on y equals 4 minus 2x satisfies the equation.; description: Labelled axes show the line y equals 4 minus 2x and table points (-1,6), (0,4), (1,2), (2,0) and (3,-2), including both intercepts.]
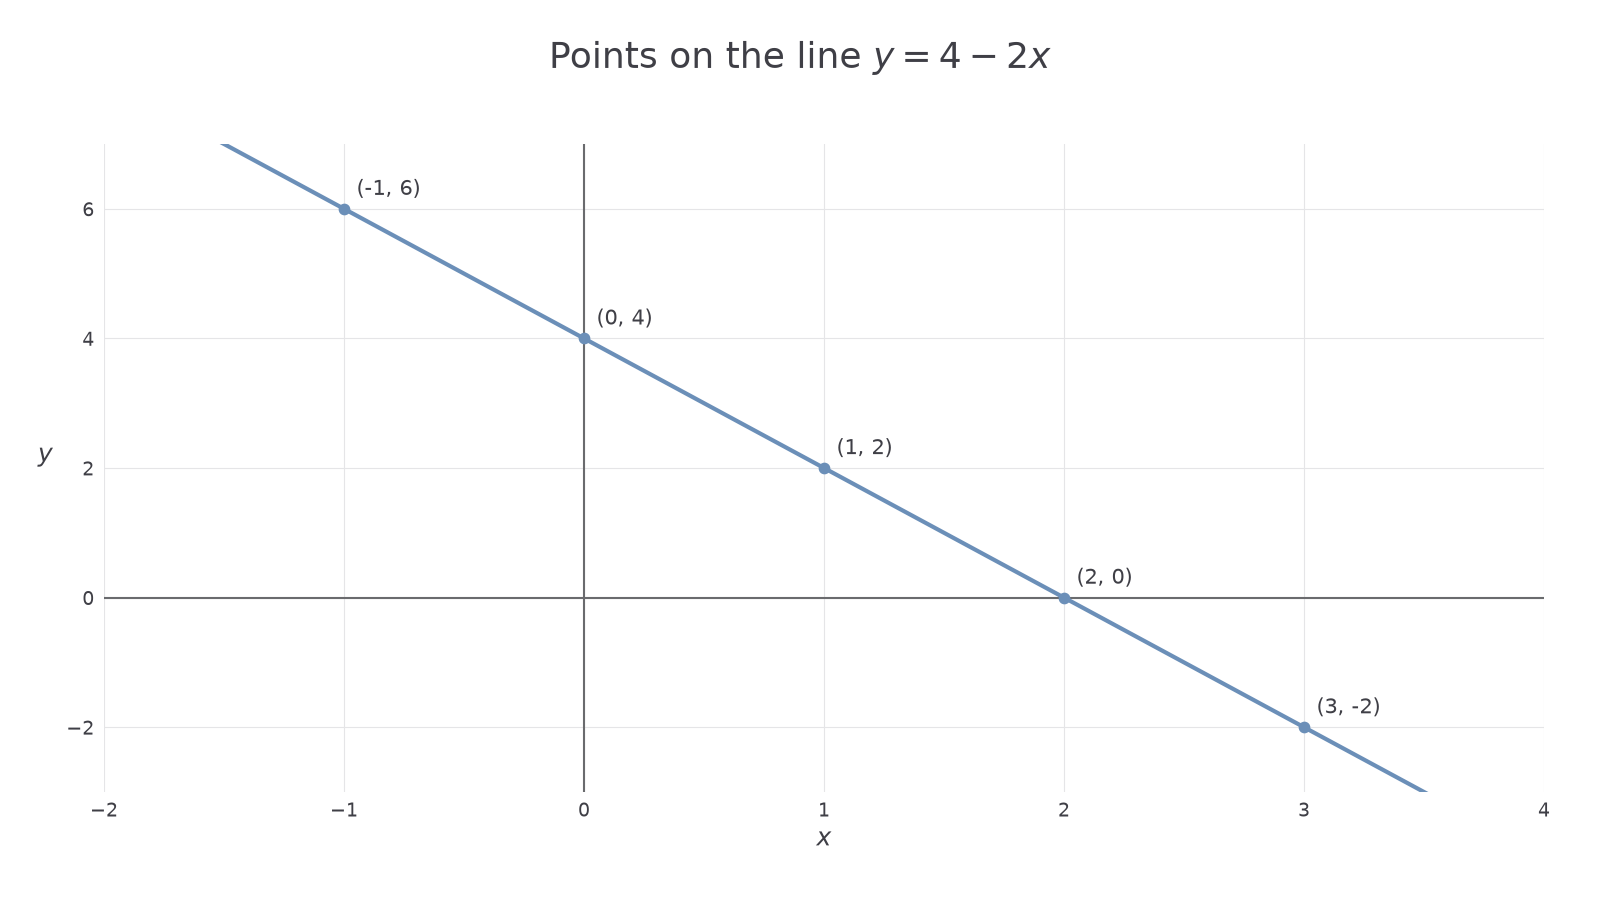
Change only the sign of the -term, keeping the same constant and input values. The line will rise instead of fall.
Worked example 4: plotting a rising line
Question. Plot for .
Plan. Use the same inputs, calculate the new outputs and rule the line.
Why check the scale before plotting? This line reaches , so the vertical scale must include that value.
Answer. Plot , then draw one ruled line through them.
Check. Each one-unit move right increases by two, consistently.
The scales on the two axes may differ, but the numerical scale along each axis must be consistent. The line also includes non-integer coordinates: lies on . For the simpler line , points are enough to construct and check it.
Horizontal and vertical lines are special cases: fixes the height; fixes the horizontal position. A vertical line is a graph of an equation, although it cannot give exactly one output for each input .
Watch out
Wrong: join an outlying point with a kink. A straight-line equation has one straight graph. Right: recalculate the suspect point, check its scale position, then draw a single ruled line.
The following text check tests the table calculation. Producing an accurate graph also requires practising the physical plotting steps on squared paper.
Gradient and intercept
The gradient measures how much a line rises or falls per unit of horizontal movement.
From to , moving two units right goes four units down. The gradient is therefore , not an angle.
Gradient of a straight line
Use two distinct points with , and take both differences in the same direction.
Not on the formula sheet: learn it.
An intercept is where a graph meets an axis. At a -intercept, ; at an -intercept, .
Continue this lesson.
You’re previewing NovaLearn without an account. Create a free account to read the rest.
Create free account