A15, R15 - Gradients, areas and rates on curved graphs
A15 uses graph gradients and areas to interpret motion and money. R15 distinguishes average change from change at one moment. You will draw and read tangents, build area estimates from simple shapes, and use the axes to decide what the answer means.
Average and instantaneous rates (Higher)
A vehicle's speeds at 0, 2, 4 and 6 seconds are 0, 4, 6 and . How can we estimate how far it travels when its speed keeps changing? First we need to separate a rate across an interval from a rate at one moment.
You already know
A straight line's gradient is its change in vertical coordinate divided by its change in horizontal coordinate. Use the scales, not the apparent angle on the page.
A chord joins two curve points. Its gradient gives an average rate over that interval. A tangent follows the curve's local direction at one specified point. Its gradient estimates the instantaneous rate there.
[DIAGRAM: asset_name: Chord and tangent gradients; asset_slug: 1ma1_m27_chord_tangent; caption: A chord measures change across an interval; a tangent follows the direction at one point.; description: Two panels plot y equals x squared. The left shows the chord between (1,1) and (3,9) with gradient 4. The right shows the tangent at (3,9), line y equals 6x minus 9, with readable points (2,3) and (4,15) giving gradient 6.]
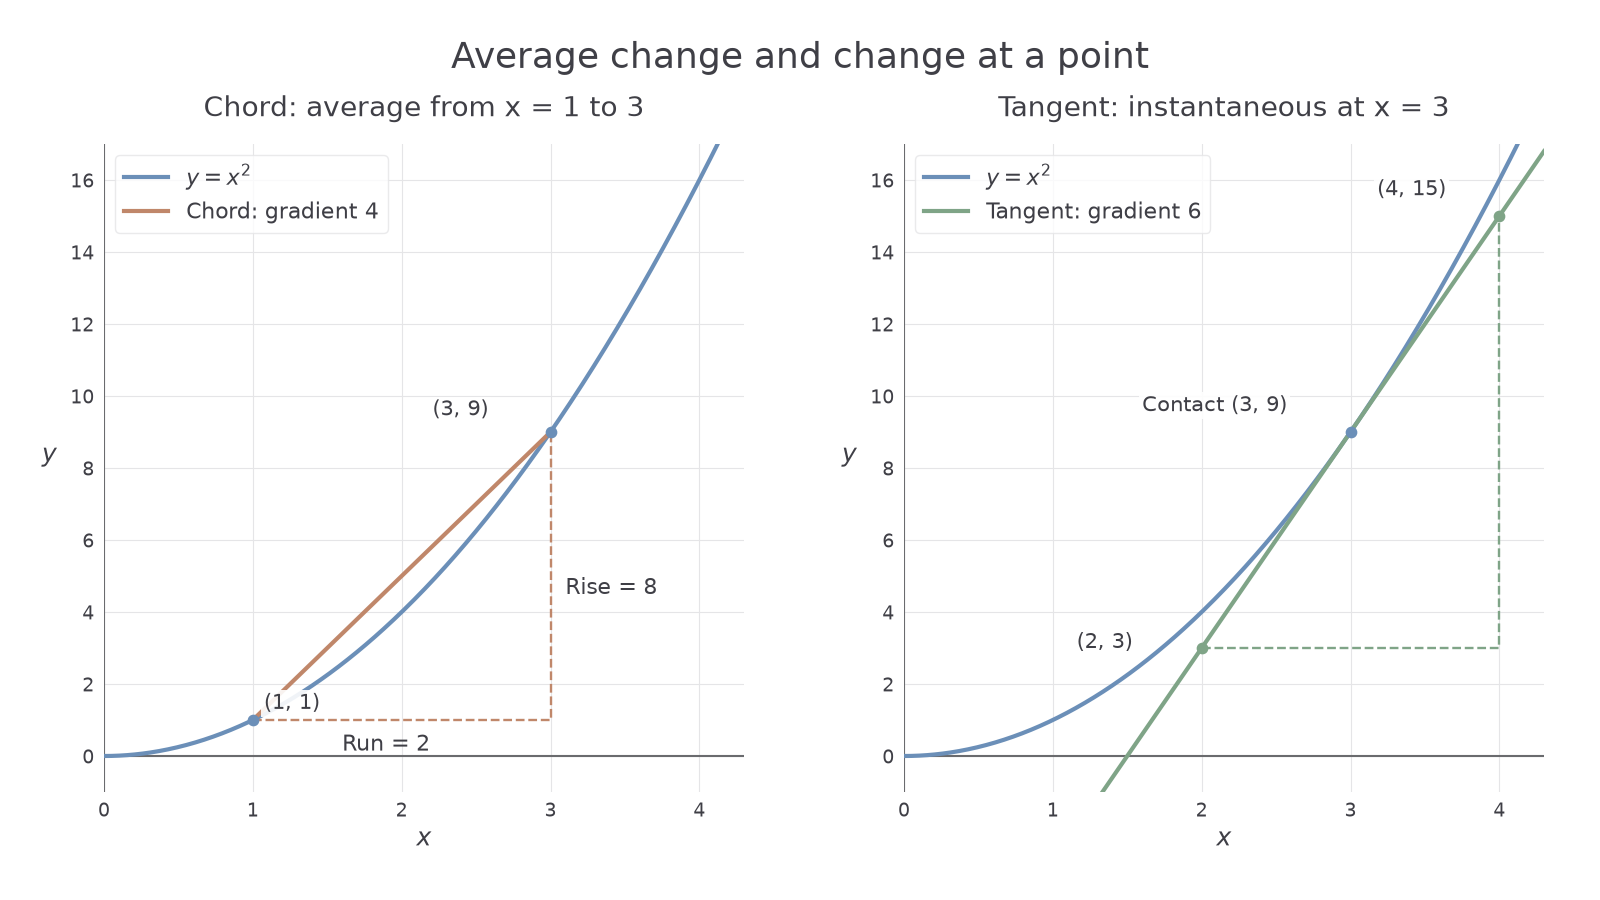
To draw a tangent, place a ruler through the target point and align it with the curve's direction very close to that point. Draw and extend the line. Choose two widely spaced, readable points on that line to make a large gradient triangle. Those points need not lie on the curve.
Worked example 1: average rate
Question. Find the average rate of from to .
Plan. Find both curve heights and calculate the chord gradient.
Why this step? Both endpoints define the interval, so use the changes between them.
Answer. The average rate is 4 output units per input unit.
Check. An increase of 2 in input gives an increase of 8 in output: .
Now keep the curve and final input 3, but change the rate requested from an interval average to an instantaneous rate.
Worked example 2: instantaneous rate
Question. The tangent at passes through and . Estimate the instantaneous rate at input 3.
Plan. Use two points on the supplied tangent line.
Why this step? The tangent's direction represents local change; the chord from example 1 represents a whole interval.
Answer. The instantaneous-rate estimate is 6.
Check. The line passes through both reading points and the contact point .
The tangent at , passing through and , has gradient 4. The increasing steepness shows that the rate changes. Your own tangent gives an estimate, affected by line placement, curve thickness and reading accuracy.
For this quadratic, a chord's gradient is simply the sum of its endpoint inputs: , for , by difference of two squares. The inputs 1 and 3 therefore give gradient 4 without finding the two heights separately.
A rule or table can supply rates too. For , and , so the average rate is . Near , the values and give . This narrow centred interval gives a local estimate. It is still a chord calculation, rather than a tangent construction. No calculus is needed.
Watch out
Using and gives gradient 7, but these are two curve points, so this is a chord. To estimate the tangent gradient at 3, choose points on the tangent, such as and .
On squared paper, plot from 0 to 4. Draw the chord from inputs 1 to 3 and a tangent at input 3. Compare your two gradients with the diagram.
Estimating area beneath a curve (Higher)
A curved boundary can be approximated by straight-edged shapes. Add their areas to estimate the area between a positive curve and the horizontal axis.
Split the horizontal interval into strips. In each strip, join the two curve heights by a straight line to form a trapezium. The two vertical heights are its parallel sides; the strip width is their perpendicular separation.
Area of one trapezium
For parallel side lengths and perpendicular separation ,
On the formula sheet (2026 version; the 2027 sheet will have the same content).
Add each strip once. Internal heights occur in two neighbouring strips, which explains the doubled middle terms in a combined calculation.
Worked example 3: four width-one strips
Question. Estimate the area under from 0 to 4 using four equal trapezia.
Plan. Calculate heights at , then add adjacent-height trapezium areas.
Why this step? The curved tops have been replaced by chords, so the sum is an estimate.
Answer. About 22 square units.
Check. The combined expression also gives 22.
Each chord lies above this upward-bending curve, so the estimate is too large.
[DIAGRAM: asset_name: Trapezium area estimate under a curve; asset_slug: 1ma1_m27_area; caption: Four straight-topped strips estimate the curved area as 22 square units.; description: The graph y equals x squared from 0 to 4 has four width-one shaded trapezia with heights 0, 1, 4, 9 and 16. Clay chords sit above the blue upward-curving boundary, showing why this estimate is too large.]
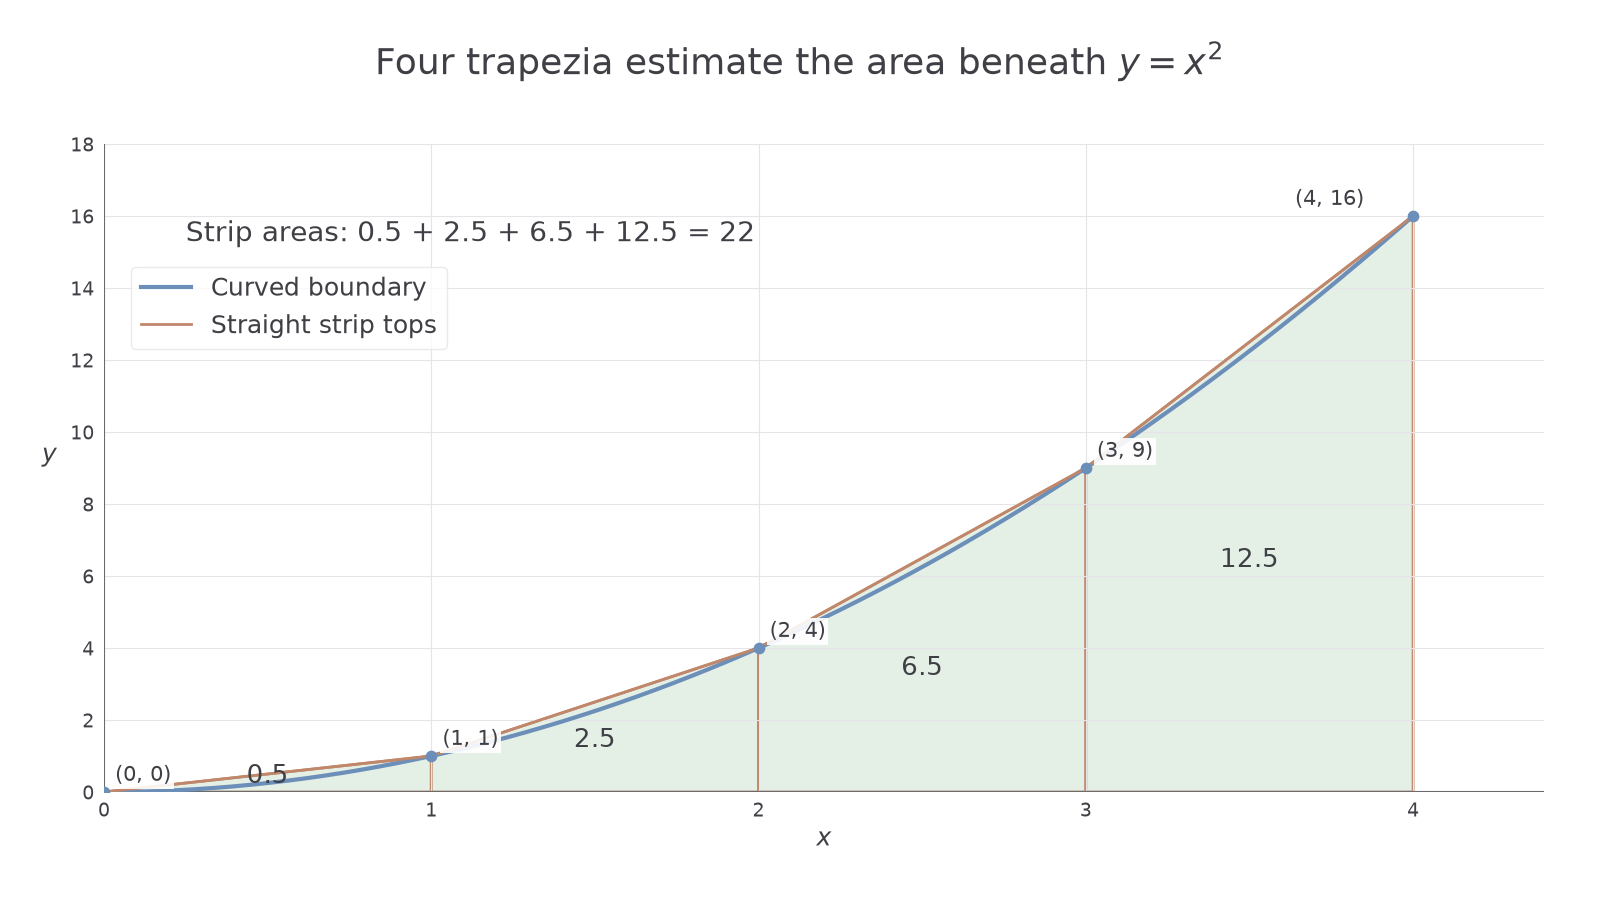
Change only the strip width, from 1 to 0.5. Keep the same curve and interval.
Worked example 4: narrower strips
Question. Repeat the estimate using eight equal trapezia.
Plan. Find the extra halfway heights and use width 0.5 throughout.
The first line squares each half-unit input; the second collects the shared interior heights; the third adds all eight strip areas.
Why this step? Narrower straight tops follow this smooth curved boundary more closely.
Answer. About 21.5 square units.
Check. This is smaller than 22, as expected when the gaps above this curve shrink.
The amount of change depends on the boundary, not a universal rule that trapezia overestimate. Chords below a downward-bending curve underestimate it. If the curve changes its bending direction, there may be no single bias. Counting grid squares is another estimate; combine partial squares sensibly.
Rectangles also provide useful bounds. For the increasing positive curve from 0 to 2, the heights are 1, 2 and 5. Two width-one left-endpoint rectangles give ; right-endpoint rectangles give . The actual area lies between them. Increasing height puts left rectangles below and right rectangles above. This conclusion uses increasing behaviour, not the trapezium bending rule.
Watch out
Writing for the strip from 2 to 3 uses a sloping length as a height. Its vertical heights are 4 and 9, so the area is .
Better subdivisions cannot repair inaccurate heights or a poor real-world model. Use reliable extra readings as well as narrower strips.
Continue this lesson.
You’re previewing NovaLearn without an account. Create a free account to read the rest.
Create free account