4.2-4.4B - Quadrat sampling and biodiversity
Ecologists often need to estimate populations without counting every organism in a whole habitat. Quadrats make this possible by sampling small, measured areas and using the results to compare larger areas. In this lesson, you will use quadrats to estimate population size, compare biodiversity, and investigate how organisms are distributed across a habitat.
Why use quadrats
A quadrat is a square frame placed on the ground to mark out a known area. It is useful for organisms that do not move away while being counted, especially plants or slow-moving animals.
Quadrat
A frame of known area used to sample organisms in a habitat.
Sampling is needed because a whole habitat may be too large to count completely. A small sample can still be useful if it is representative: the quadrats should reflect the area being studied rather than only the easiest or most obvious patches.
The word is quadrat, not quadrant. A quadrant is a quarter of a circle or graph. A quadrat is the ecological sampling frame.
Good quadrat data usually records one of these:
- the number of individuals of a named species in each quadrat
- whether each species is present or absent
- the percentage cover of a species when individuals are hard to count separately
When the target organisms are separate and countable, use counts. When plants overlap or grow in mats, percentage cover can be more practical, but it is more subjective because it depends on judgement.
Random samples in two areas
To investigate the population size of an organism in two different areas, use the same method in both areas. The comparison is only valid if the sampling method is fair.
A typical method is:
- Mark out each study area using two tape measures at right angles.
- Use a random number generator or random number table to choose coordinate pairs.
- Place the same size quadrat at each coordinate.
- Count the target organism in each quadrat, or estimate percentage cover if separate individuals cannot be counted.
- Repeat with several quadrats in each area.
- Calculate a mean for each area, then compare the means or scale up to estimate the total population.
Random coordinates matter because they reduce bias. If students choose "interesting" patches by eye, they may overestimate the number of plants. Throwing a quadrat is also not a reliable random method because people may aim without realising it.
[DIAGRAM: asset_name: Quadrat sampling and biodiversity - diagram 01; asset_slug: b56_quadrat_sampling_and_biodiversity__diagram_01; recommended_method: deterministic_drawing; description: Monochrome two-area quadrat sampling method. Each area has two tape-measure axes at right angles, random coordinate pairs, several same-size quadrats, counts of a target plant, and a flow from counts to mean count to estimated population.]
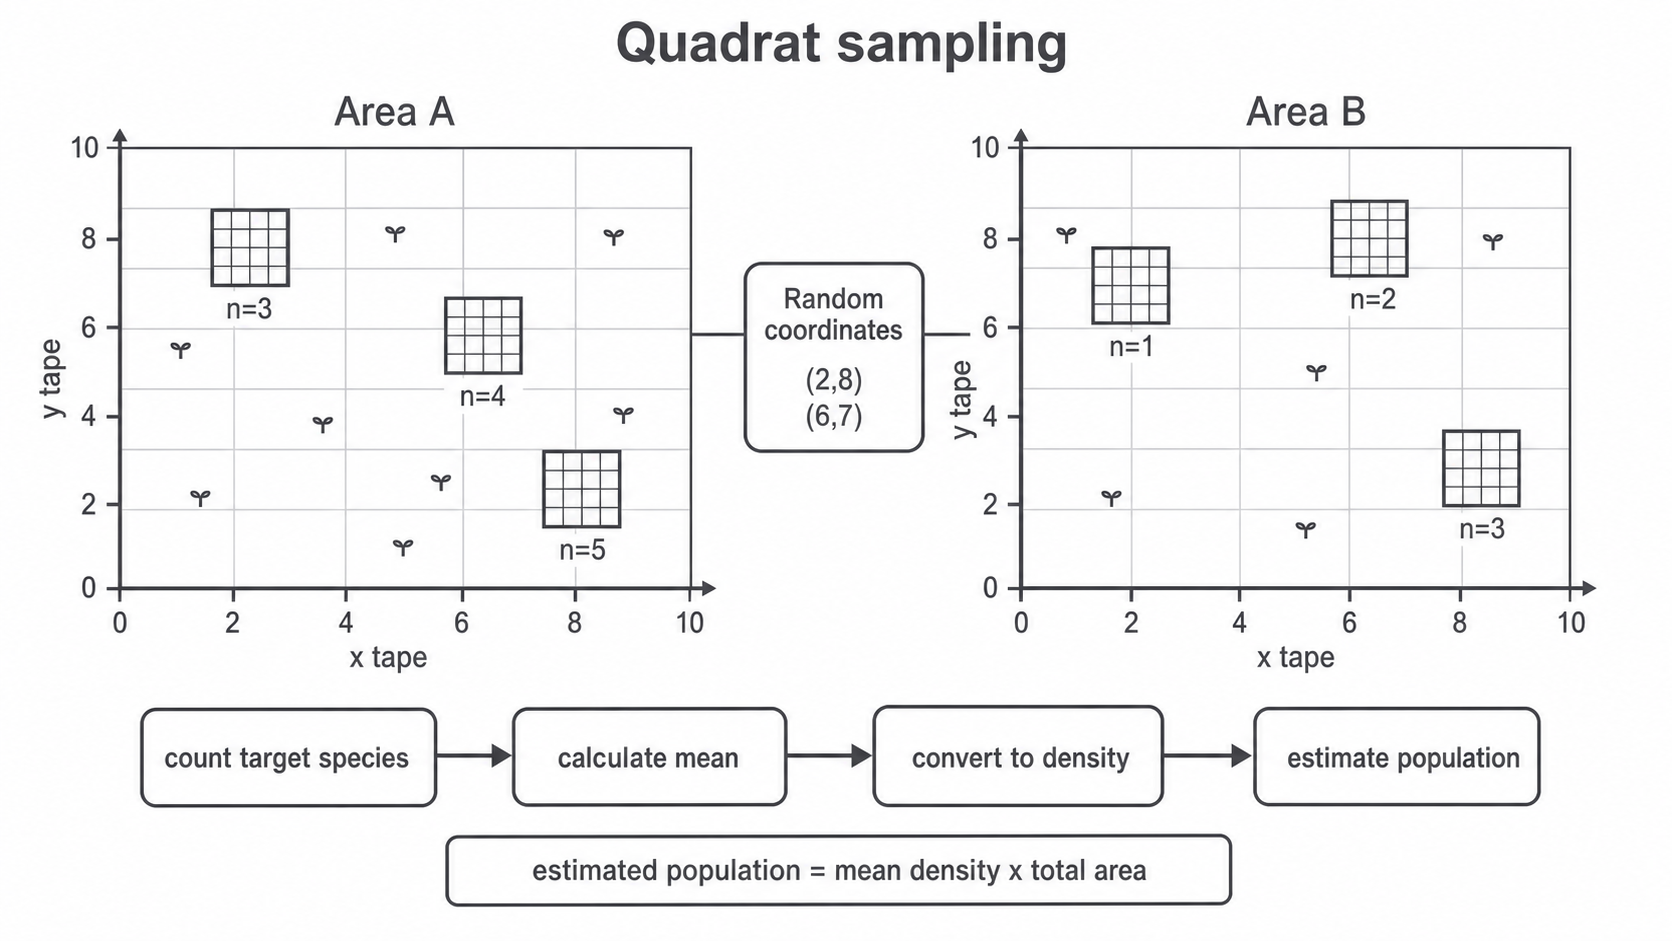
Keep important control variables the same: quadrat size, number of quadrats, target species, counting rule, and the time or season of sampling where possible. Fieldwork also needs simple safety planning: avoid trampling sensitive habitats, wash hands after handling soil or plants, and follow local guidance about hazards such as steep ground, nettles or ticks.
Estimating population size
A quadrat count gives the number of organisms in a small known area. To estimate the population size in a larger area, first calculate the mean number per quadrat, then scale up using area.
Population estimate from quadrats
For example, a 0.5 m by 0.5 m quadrat has an area of 0.25 m^2. If five quadrats contain 3, 5, 4, 2 and 6 clover plants, the mean is:
The density estimate is:
If the whole area is 40 m^2, the estimated population is:
Continue this lesson.
You’re previewing NovaLearn without an account. Create a free account to read the rest.
Create free account