4.2 - The one-sample t-test
A small sample can test a claim about a population mean even when the population variance is unknown. You will estimate that variance, use a t-distribution with the correct degrees of freedom and tail, and express the conclusion as evidence about the population.
Normal samples with unknown variance
Sixteen measurements have mean and estimated standard deviation . Is that convincing evidence that the population mean exceeds ? The difference matters only in relation to the uncertainty in the sample mean.
For a small random sample, the one-sample t procedure assumes independent observations from a normal population. The population variance is unknown: we estimate it from the sample. A small sample does not make a non-normal population normal. Random sampling and the model assumptions are separate requirements.
Recall why the divisor in an unbiased variance estimate is one less than the sample size. The deviations from the fitted sample mean sum to zero: once deviations are known, the last is fixed. Estimating the mean has used one degree of freedom.
Unbiased sample variance
For independent observations,
Here estimates the population variance; . The standard error of the mean is estimated by .
The mean and unbiased variance formulae are in the formula booklet. The standard-error relationship must be understood and applied.
Unbiased means that over repeated samples the estimate averages to the true population variance; an individual estimate can be above or below it. The booklet also gives the descriptive standard deviation with divisor . That describes the observed data; it is not the unbiased variance estimate used in this t-test.
Worked example 1: estimating from observations
Question. An independent random sample from a normal population is . Find the sample mean and an unbiased estimate of the population variance.
Plan. Find the mean, then add squared deviations and divide by .
There are five observations, so
Answer. and .
Check. The raw squares total . The alternative numerator is , agreeing with the sum of squared deviations.
Now change only the way the same information is supplied. Summarised data need the same correction for estimating the mean.
Worked example 2: estimating from summaries
Question. A normal random sample has , and . Find , and the estimated standard error of .
Plan. Recover the centred sum of squares before dividing by four.
Answer. , , estimated standard error .
Check. The five observations in Worked example 1 realise exactly these summaries. Also, multiplying the standard error by recovers .
Keep the variance and standard deviation distinct: the t statistic below divides by a standard error, not by a variance.
The t statistic
The t statistic measures how far the sample mean is from the claimed population mean in estimated standard-error units.
If the population standard deviation were known, standardising a normal sample mean would give a standard normal variable. Replacing that fixed standard deviation by the random estimate adds uncertainty. The resulting t-distribution is symmetric about zero, with heavier tails than the standard normal distribution; its shape depends on the degrees of freedom.
One-sample t statistic
Under , for an independent normal sample with unknown variance,
The observed value is . The numerator fixes the sign. A positive value points towards a mean above .
The t statistic is not printed in the formula booklet; the t critical-value table is provided.
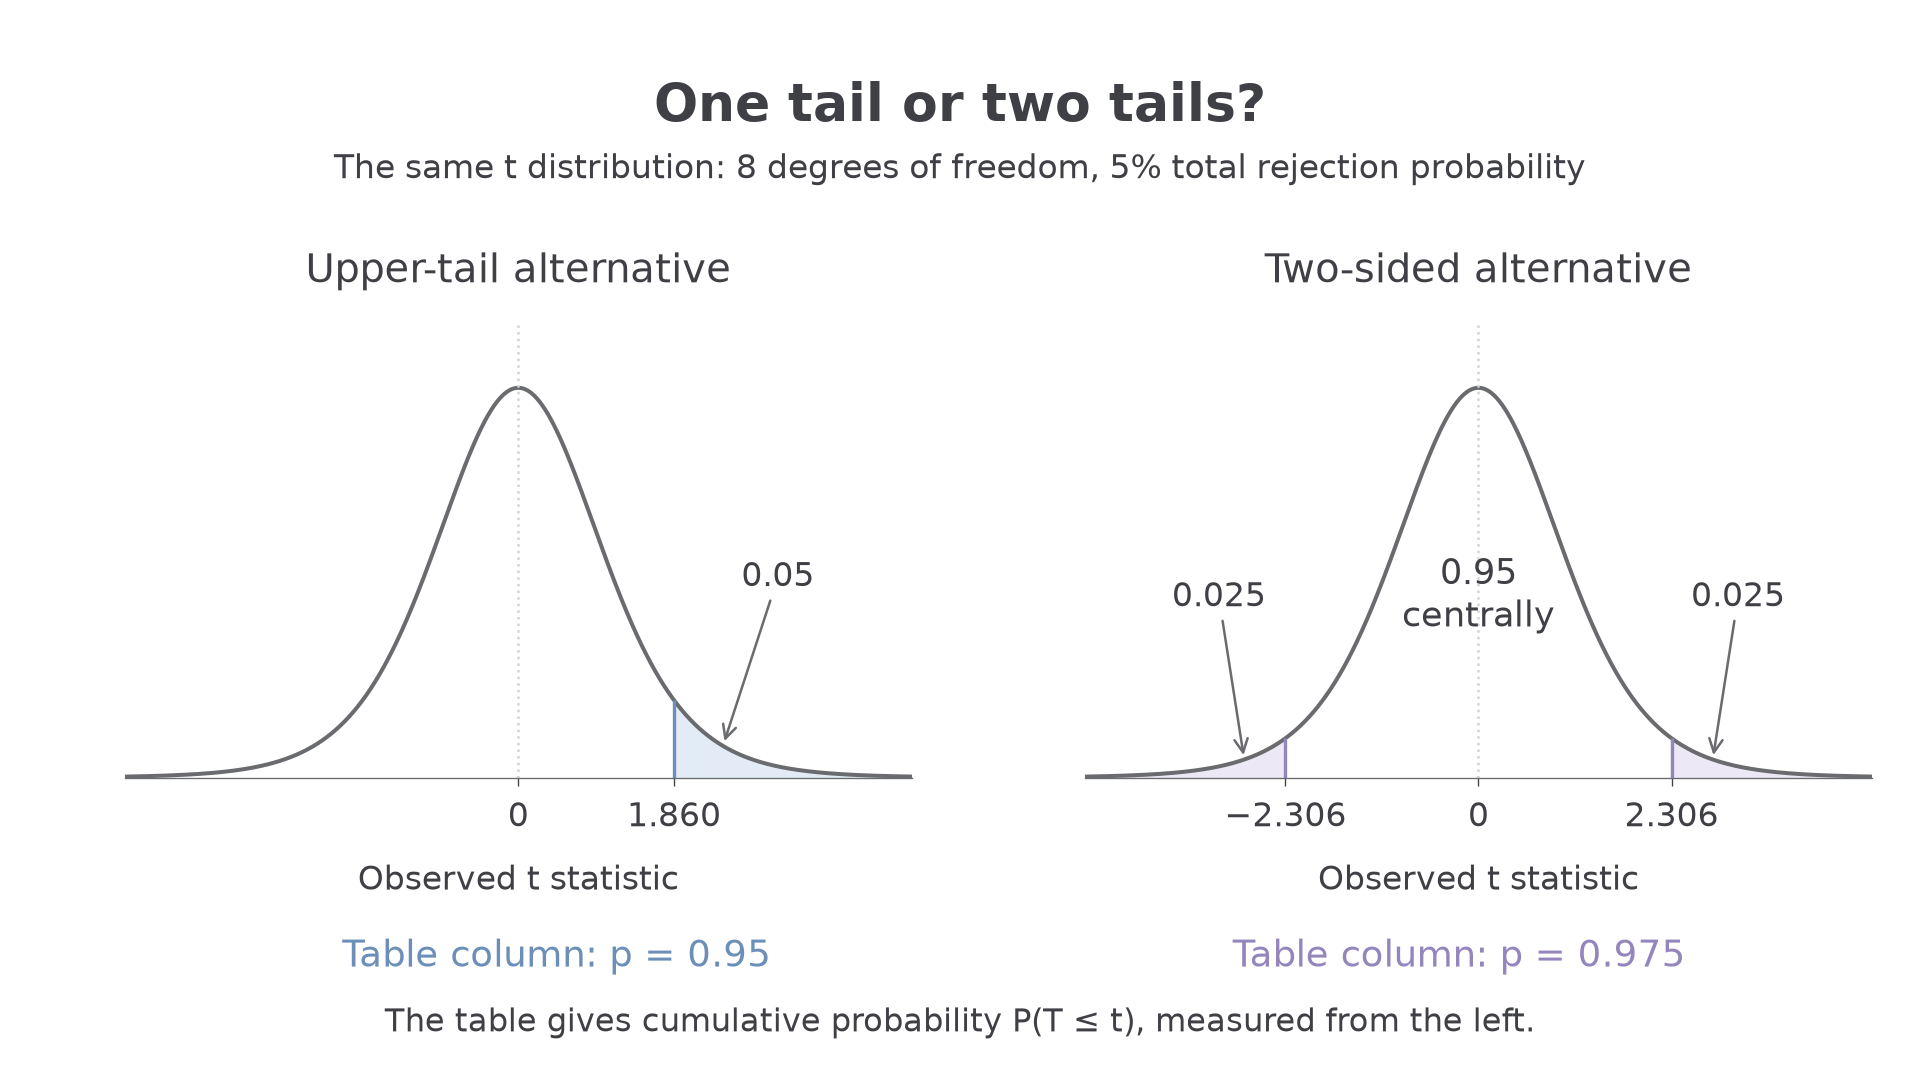
The table gives satisfying , not an upper-tail probability of . At significance level , an upper-tail test uses ; a two-tail test puts in each tail and uses . For a lower-tail test, use symmetry to negate the corresponding positive value.
[DIAGRAM: asset_name: One tail or two tails; asset_slug: cam9231-t-test-tails; caption: At 5% significance, one upper tail starts at 1.860 but two tails start at plus or minus 2.306 for eight degrees of freedom; description: Two exact t density plots with eight degrees of freedom. The left plot shades the upper 0.05 tail beyond 1.860. The right plot shades two 0.025 tails beyond minus 2.306 and 2.306. The unshaded central probability is labelled 0.95 on the right. Labels distinguish the cumulative table columns p equals 0.95 and p equals 0.975.]
Continue this lesson.
You’re previewing NovaLearn without an account. Create a free account to read the rest.
Create free account