2.4 - Bounding sums with integrals
A curve can tell you how large a sum is without adding all its terms. You will compare rectangles with integrals, derive finite bounds, and recognise sums whose shrinking rectangles approach an exact area.
Area comparisons
How can you estimate when is very large? Think of each term as the height of a rectangle of width .
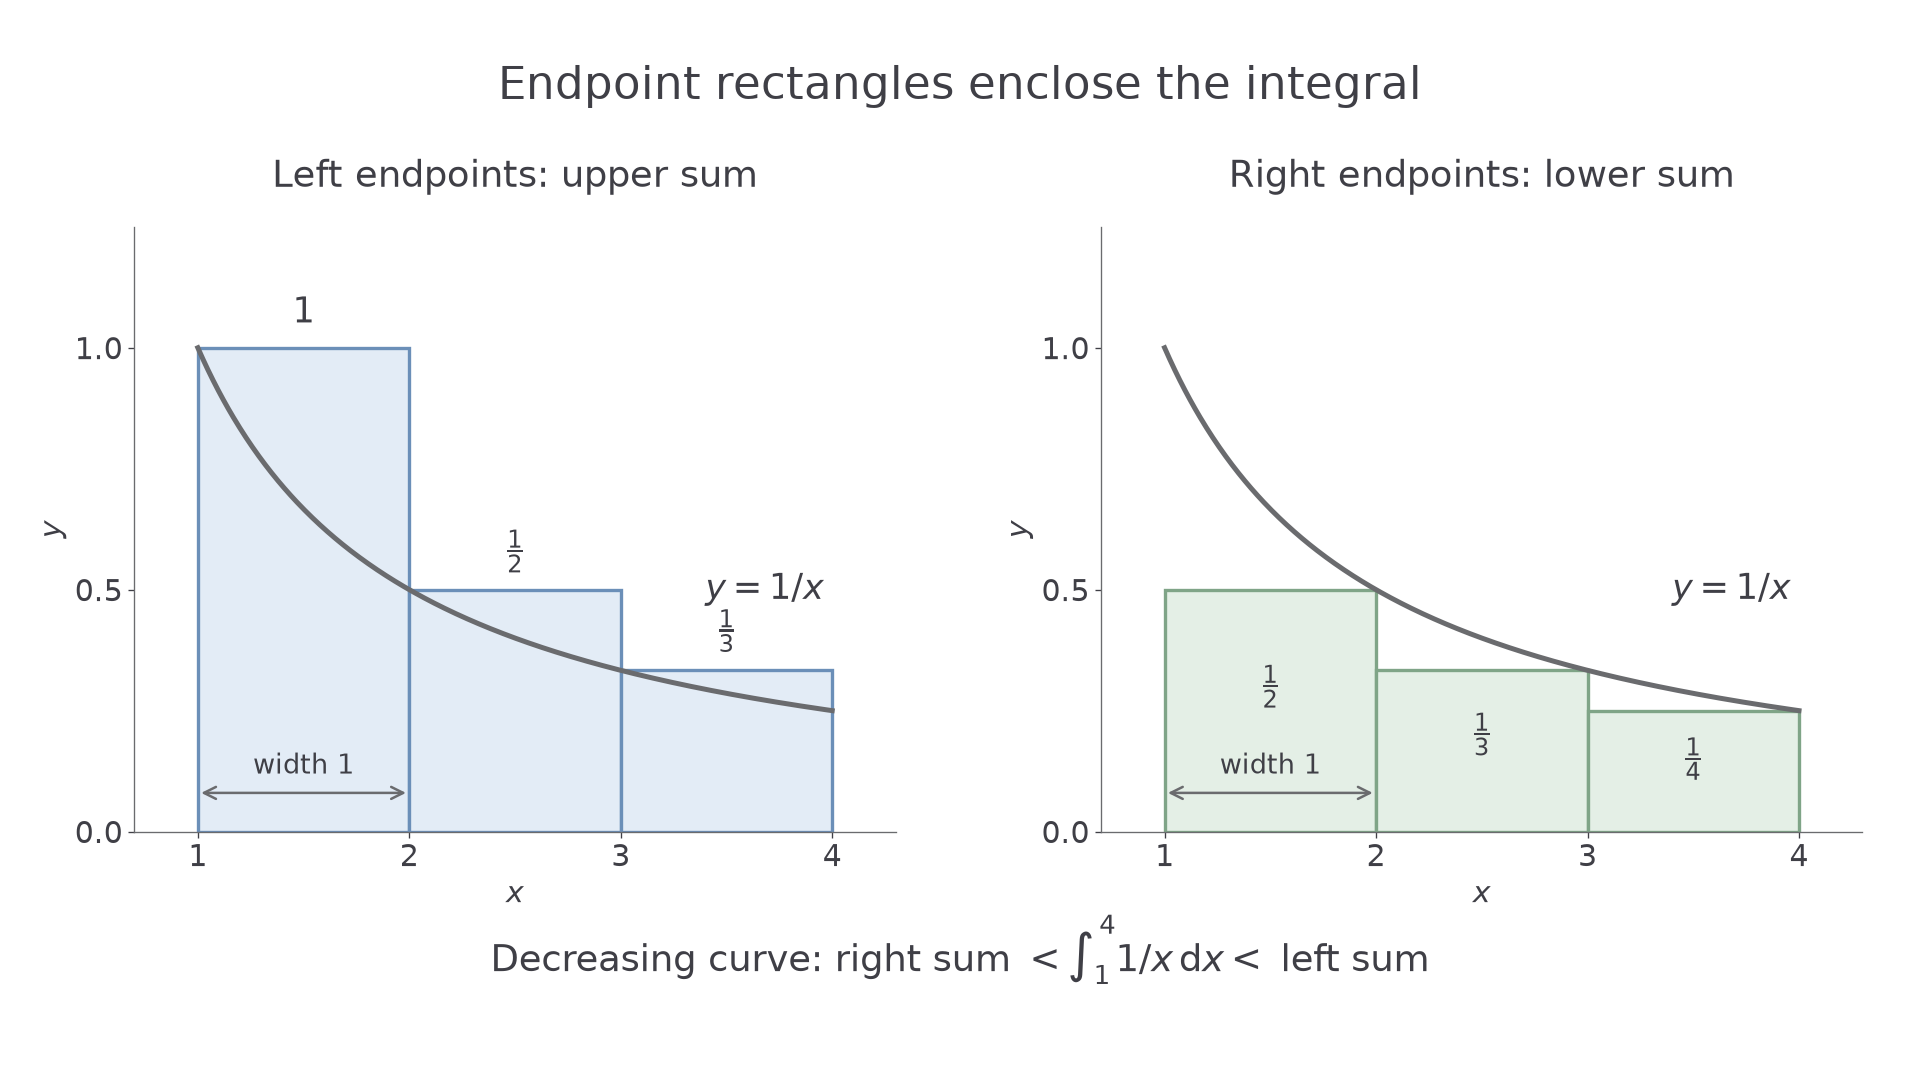
On , the decreasing curve lies below the rectangle of height and above the rectangle of height . On , the corresponding heights are and . Adding these inequalities compares an area with sums.
[DIAGRAM: asset_name: Endpoint rectangles enclose an area; asset_slug: cam9231-integral-rectangles; caption: For a decreasing function, left endpoints give upper rectangles and right endpoints give lower rectangles; description: Two equal-scale panels show y equals 1 over x on 1 to 4 with three unit-width rectangles. The left panel uses heights 1, one half and one third above the curve; the right uses one half, one third and one quarter below it. Endpoint heights, width one and the upper or lower comparison are labelled.]
Upper and lower rectangle sums
On an interval divided into equal widths , a rectangle has area . For a nonnegative decreasing function, left-endpoint heights give an upper sum and right-endpoint heights a lower sum. For an increasing function, the roles reverse.
If the function is strictly increasing or strictly decreasing, each rectangle differs from the curve over an interval of positive width. The corresponding area inequalities are strict. For a function that can be constant, use non-strict inequalities instead.
Worked example 1: a decreasing curve
Question. Use unit-width rectangles to bound .
Plan. Add right-endpoint heights for the lower bound and left-endpoint heights for the upper bound.
There are two intervals, and . Since decreases,
Answer. .
Check. Direct evaluation gives , which lies between and .
Change the monotonic direction. The endpoint rule must change with it.
Worked example 2: an increasing curve
Question. Use unit-width rectangles to bound .
Plan. Check that increases on this interval, then use left endpoints for the lower sum.
Each height has been multiplied by width .
Answer. The integral is strictly between and .
Check. Its exact value is , which satisfies both bounds.
For a curve that changes monotonic direction, split the interval at the turning point before choosing endpoint rectangles. A single left-endpoint rule need not bound the whole area.
Watch out
“Left endpoints always overestimate” is false. Decide whether the function increases or decreases on the interval before choosing the inequality sign.
Apply the increasing-curve rule to a new integrand.
Upper and lower bounds
To bound a sum, choose integration limits that make the rectangle heights match its first and last terms. Different placements can produce different valid bounds.
For a positive strictly decreasing function and an integer , left rectangles on have heights . Right rectangles on have heights . Therefore
The isolated on the right repairs the missing first term. These comparisons come from rectangles; they are not formulae supplied in MF19.
Worked example 3: a harmonic sum
Question. Show that, for integers ,
Plan. Use in the two rectangle placements.
Since for ,
The first integral is . Add to the second inequality to include the term with .
Answer. .
Check. At , the sum is , and . The general bounds also show why the sum cannot settle at a finite limit: its lower bound grows without bound.
Change only the exponent in the denominator. The geometric comparison stays the same; its integral changes.
Continue this lesson.
You’re previewing NovaLearn without an account. Create a free account to read the rest.
Create free account