3.2.3.3 - Inflation, deflation and disinflation
Learn how price levels and inflation rates differ, how demand, costs, money and expectations influence prices, and why inflation and deflation have different consequences for households and the economy.
Price levels and rates
Inflation is a sustained increase in the general price level; deflation is a fall in the general price level; disinflation is a fall in the rate of inflation.
The price level is the height of a price index at a date. Inflation measures its percentage change over a stated period, using the earlier level as the denominator. A fall in one product's price does not establish general deflation. A falling positive inflation rate means prices still rise, but more slowly.
An illustrative price index rises from 100 to 110, then to 115.5, before falling to 113.19. The first rise gives inflation; the second gives 5%. That is disinflation with a still-rising level. The final change is −2%, so it is deflation. At 113.19 the level is still above the initial 100: a price fall does not necessarily reverse earlier rises.
The ONS October 2023 CPI bulletin reported annual CPI inflation of 4.6%, compared with the October 2022 peak of 11.1%. These are dated annual rates, not price-index levels. The lower positive rate illustrates disinflation; it does not say that the overall price level returned to its earlier level. A year-on-year rate compares the same month a year earlier, so changing base-period prices can influence the rate even when the latest monthly movement is small.
Deflationary policies aim to reduce AD, for example through lower government spending or higher interest rates. They may slow inflation without making it negative. Their effect depends on the starting gap, supply conditions, expectations and transmission lags: the word “deflationary” does not guarantee a falling price level.
Demand, costs and international prices
Demand-pull inflation comes from stronger spending relative to supply, while cost-push inflation comes from higher production costs or reduced supply.
When AD shifts right, firms may expand output and raise prices. The closer the economy is to sustainable capacity, the stronger the price pressure is likely to be. Strong consumption, investment, government spending or export demand can drive this process. In contrast, higher energy, food-input or wage costs not matched by productivity shift SRAS left: the price level rises while real output falls. Cost-push inflation can therefore coexist with higher unemployment.
The two panels use exact illustrative curves. Initially and meet at . With demand-pull pressure, AD becomes : output and the price index both rise to 110. With cost-push pressure, SRAS becomes , while AD is unchanged: output falls to 90 and the price index rises to 110. The diagrams compare price levels at equilibrium; a continuing inflation rate requires continuing changes, not just one shift.
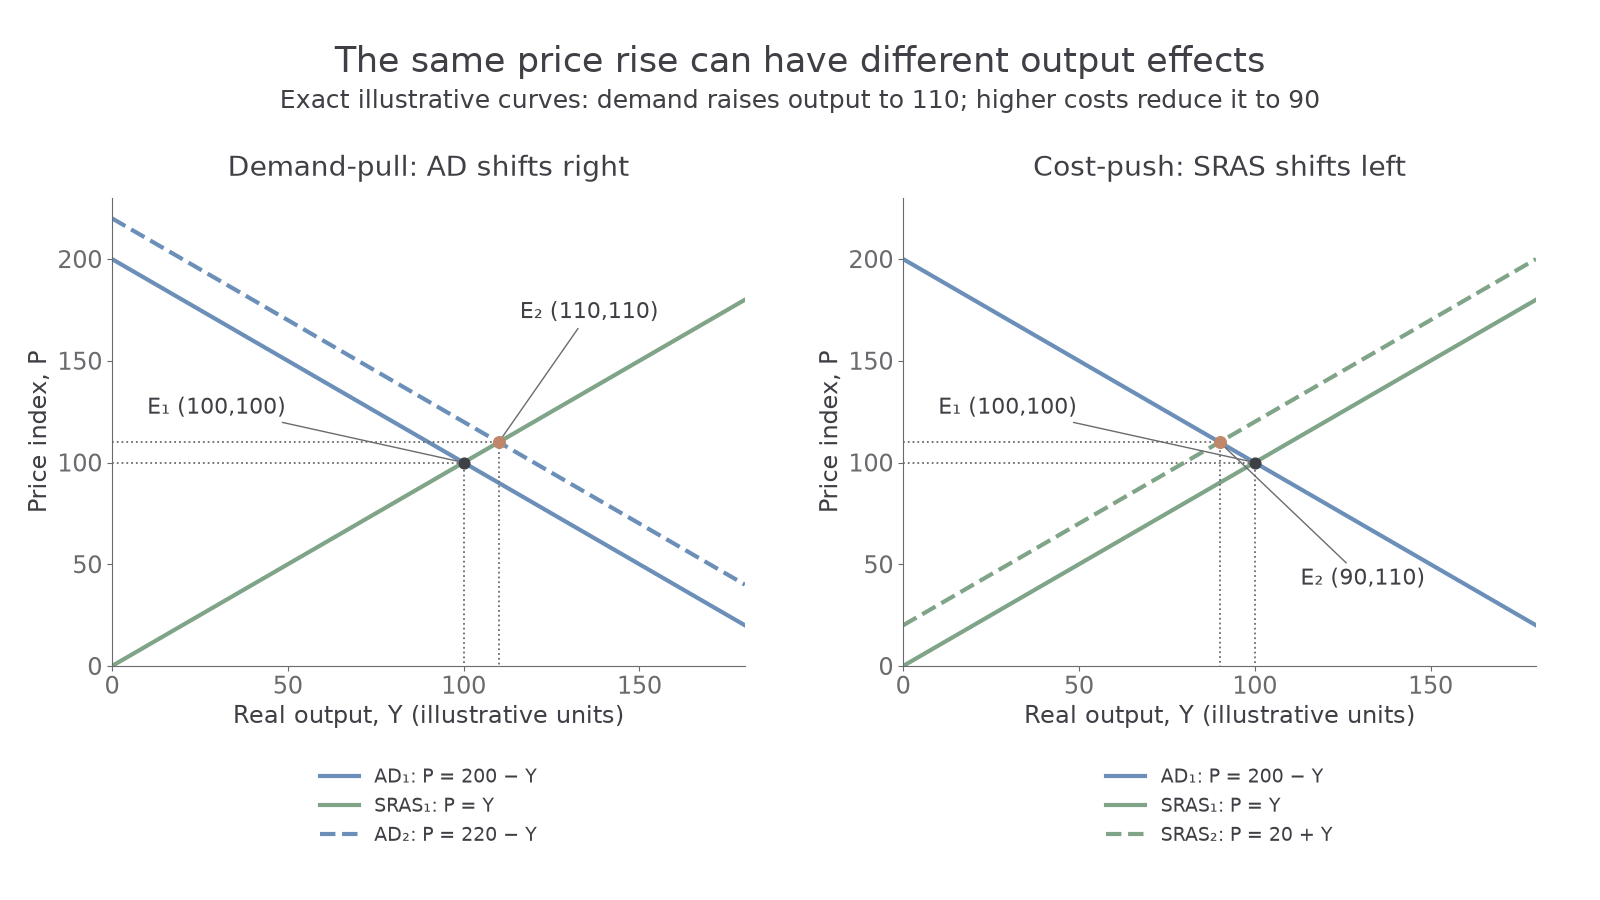
In your notebook, label price level vertically and real output horizontally, identify the cause, shift its curve, and mark old and new intersections. Keep a movement along an unchanged curve distinct from a shift. To explain the outcome, link the change in spending or costs to both output and prices; a labelled shift alone does not establish the mechanism.
The UK is connected to world prices and other economies. A rise in world oil or gas prices raises imported energy costs directly and raises transport and production costs indirectly. Supply disruption abroad can raise imported component costs. Inflation in trading partners can make UK imports more expensive, depending on exchange rates, contracts and firms' margins. A depreciation of sterling can amplify imported-price pressure, while an appreciation can offset some of it. Pass-through is not always immediate or complete.
Foreign expansion can also increase demand for UK exports and global commodities, combining a UK AD channel with a costs channel. A foreign downturn can weaken UK export demand and commodity prices. The Bank of England's November 2022 report linked high UK inflation to increased gas prices following Russia's invasion of Ukraine, pandemic-related pressures on traded goods and domestic pressures. That dated evidence supports multiple mechanisms rather than an explanation based on UK demand alone. The relative importance of each channel depends on import exposure, spare capacity and how long the shock lasts.
Money and the Quantity Theory
Fisher's equation of exchange connects money spending with the money value of output, but the identity alone does not prove that money growth causes an identical inflation rate.
Here is the money stock, is its income velocity—the number of times it turns over in spending on final output during the period— is the general price level and is real national output. is nominal national income. A version uses , the volume of transactions, instead of ; using final output avoids counting intermediate transactions repeatedly as national income. Use a consistent period and compatible units.
For a numerical illustration, suppose , per year and billion real output units per year. Nominal output is £400 billion, so per output unit. With and unchanged , nominal output becomes £440 billion and : both money and prices rise by 10%.
Continue this lesson.
You’re previewing NovaLearn without an account. Create a free account to read the rest.
Create free account