3.1.5.5 - Oligopoly strategy and interdependence
Learn how rival reactions shape oligopoly decisions, why coordination can be unstable, and how different models explain prices, investment and market performance.
Interdependence and uncertain reactions
A major oligopolist affects its rivals' sales, so its best decision depends on what those rivals do. Interdependence creates uncertainty about whether a price cut will win customers, trigger matching cuts or start a price war. Demand, costs and the future can be uncertain too, but strategic uncertainty specifically concerns other firms' reactions.
Game theory studies choices whose payoffs depend on the choices of others. The original illustrative table gives annual profits in £ million for two firms choosing a high or low price. Each cell lists A's profit first, B's second. They choose simultaneously and each seeks its own profit.
| A's choice / B's choice | B chooses high | B chooses low |
|---|---|---|
| A chooses high | 8, 8 | 2, 12 |
| A chooses low | 12, 2 | 4, 4 |
If B chooses high, A earns 12 by choosing low rather than 8 by choosing high. If B chooses low, A earns 4 by choosing low rather than 2 by choosing high. Low is therefore A's dominant strategy, the best choice whatever B does. The same comparison applies to B. Both choose low and earn 4 each; neither can improve its own payoff by changing alone. This is a Nash equilibrium.
Both high would produce the largest combined profit, million, compared with £8 million at both low. Yet either firm can gain £4 million by cutting price while the other stays high. Individual incentives undermine the jointly attractive outcome. An agreement alone does not remove that temptation.
This is one model under stated payoffs, not a universal prediction. Repeated dealings can make future retaliation important; differentiated products, asymmetric costs or capacity limits change the payoff table. A firm may be unsure about another's costs or strategy. Read each supplied game's actual payoffs rather than assuming every oligopoly has a dominant-strategy price war.
Cooperation, collusion and cartels
Cooperation means firms working together. It may improve production or compatibility, for example sharing research on a technical standard. Collusion is coordination that reduces competitive rivalry, for example fixing prices, limiting output or dividing customers to increase profits. Cooperation is a broader concept; its competitive effect depends on what is coordinated. A research partnership is not automatically a price agreement.
In collusive oligopoly, firms coordinate instead of independently competing. A cartel is an explicit organised arrangement, often setting a joint price or total output and allocating quotas. Restricting joint output can allow the group to act like a single monopolist and maximise joint profit: choose the industry's profit-maximising total, then allocate production and returns. A firm should not independently apply its own MR=MC rule while also assuming a fixed cartel allocation without explaining the agreement.
In non-collusive oligopoly, firms choose independently, while still responding strategically to each other. Parallel price changes do not alone prove an agreement: firms can face the same cost changes or rationally respond to visible rival prices. Coordination may be explicit or tacit, with firms recognising a common interest in restraint without a formal agreement; economic description does not by itself settle the legal status of a particular case.
Cartels must monitor output, share profits and discourage cheating. A member can sell extra output or offer a secret discount while others maintain the higher price. The payoff table illustrates that incentive. Few firms, similar costs/products, stable demand and transparent transactions can make monitoring easier; new entry, many different offers, hidden discounts and disagreement over quotas can undermine coordination. Entry barriers may protect the high-profit opportunity, but they do not remove conflicts within the group.
Kinked demand and price rigidity
The kinked demand model illustrates one possible pattern of rival reactions. Starting from an existing price, rivals are assumed not to follow a price rise but to match a price cut. Above the current price, a firm loses many customers to unchanged-price rivals, so its demand is relatively elastic. Below it, matching cuts prevent a large gain of market share, so demand is relatively inelastic. The two branches meet at a kink.
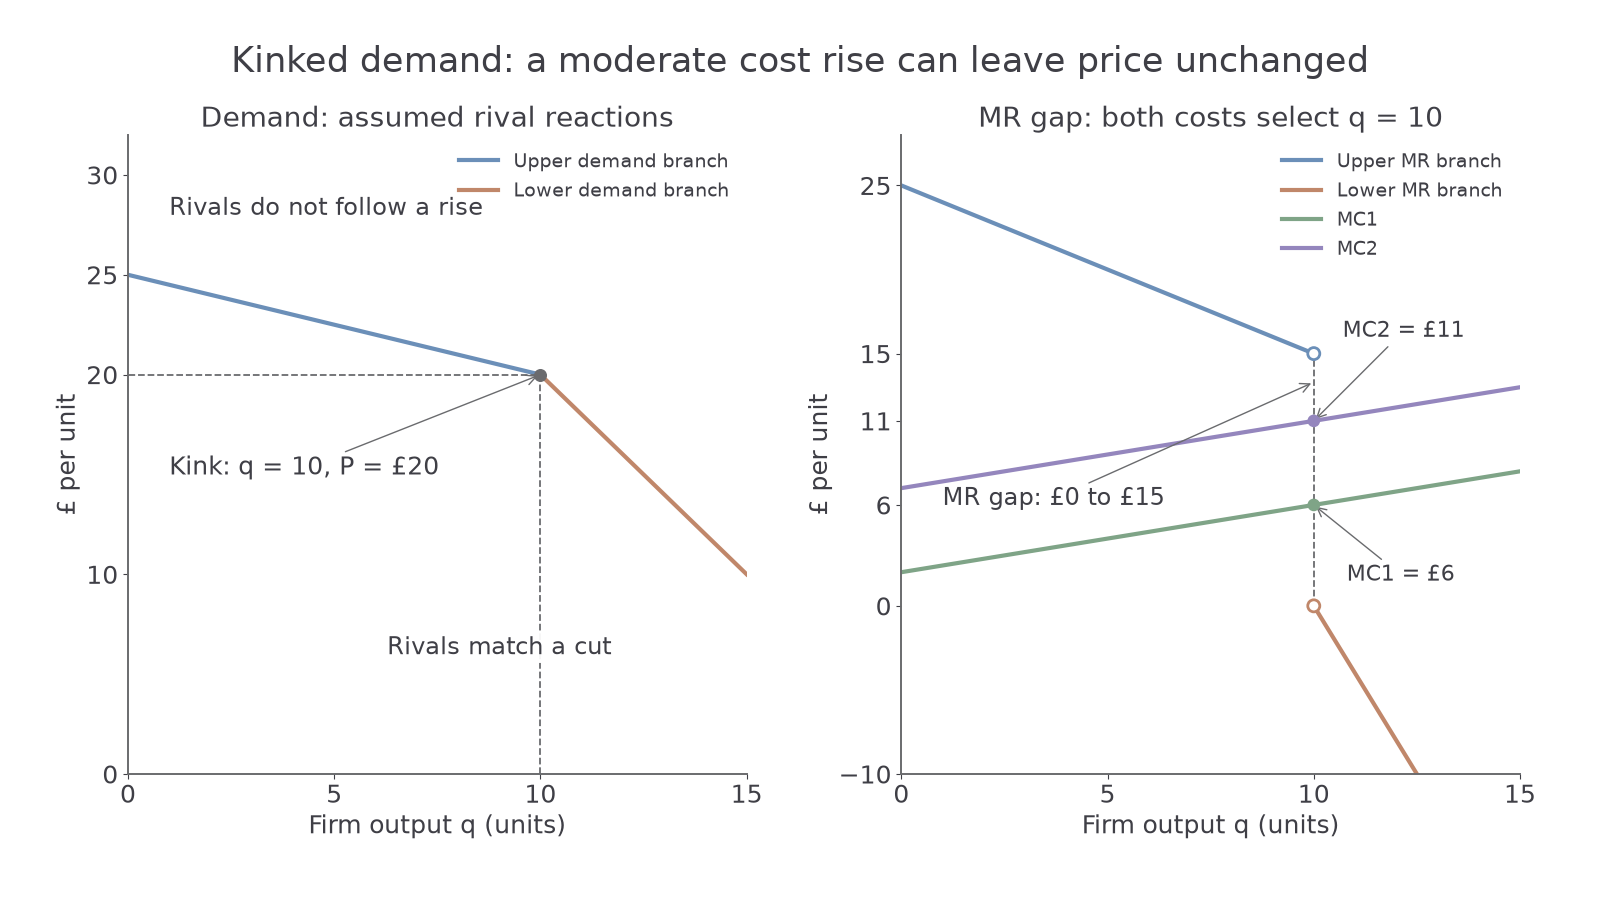
In the original diagram the kink is at 10 units and £20. The flatter upper demand branch leads to an MR value of £15 immediately before output 10; the steeper lower branch leads to MR of £0 immediately after it. The MR curve consequently has a discontinuity between 0 and 15 at that output. This is a gap between branches, not a continuous vertical MR segment selling extra units at all those marginal revenues.
MC1 is £6 at output 10 and MC2 is £11 there. Both lie in the MR gap: just below the kink extra revenue exceeds extra cost, while just above it extra cost exceeds extra revenue. Both therefore select output 10 and price £20. A moderate cost increase can reduce profit without changing price or output, explaining price rigidity. A sufficiently large cost change outside the gap can change the optimum.
For notebook construction, draw the flatter branch above the initial price and the steeper branch below it meeting at the same output/price. Draw their corresponding MR branches with a gap directly below the kink, then show MC passing through the gap. Label axes as output and cost/revenue per unit and project the kink to each axis. The firm still chooses price from demand, not from MC.
Continue this lesson.
You’re previewing NovaLearn without an account. Create a free account to read the rest.
Create free account