3.1.3.6 - Interrelated markets
Learn how a change in one market travels to another through complementary or substitute goods, competing uses, production inputs and joint products. Trace each link rather than assuming all related prices move together.
Joint and competitive demand
Markets are interrelated when a change in one affects the demand or supply conditions in another. Joint demand occurs when goods are used together as complements: printers and compatible ink, or cars and fuel. A lower printer price can increase printer purchases, raising demand for compatible ink at each ink price. With ink supply unchanged, ink's equilibrium price and quantity tend to rise. The printer-price change shifts ink demand because it is the price of a different good.
Competitive demand occurs when goods are substitutes for the same want: rail and coach travel between the same towns. A higher rail fare may make coach travel more attractive, shifting coach demand right. With coach supply unchanged, coach price and quantity rise. A lower rail fare tends to have the opposite effect.
The cross-price link matters. A rise in the price of a complement tends to reduce demand for the other good; a rise in the price of a substitute tends to increase it. Do not infer the relationship from the fact that both goods are popular. The strength depends on how closely they are linked, consumer alternatives and the time available to adjust.
For an illustrative supply disruption, train cancellations reduce rail service supply and raise its price under flexible pricing. Travellers then switch to coaches, shifting coach demand right. In the coach market, supply has not shifted merely because more seats are sold: the higher price produces extension along existing coach supply. New coach operators entering later would be a separate supply shift.
Composite demand and competing uses
Composite demand means a good is demanded for more than one use. Wheat is used for bread, animal feed and other products; land can serve housing, farming or industrial uses. This concerns several demands for the same resource, rather than demand for two goods consumed together.
Suppose demand for wheat for animal feed increases. Overall wheat demand shifts right. With wheat supply unchanged, its equilibrium price rises. Bread producers now face a higher input cost, which can shift bread supply left, raising bread prices and reducing bread quantity, other things equal. The originating change is a demand increase in the wheat market; the transmitted change is a supply decrease in the bread market.
When wheat supply is constrained, greater use for one purpose can also reduce availability for another. Higher feed demand does not create a separate physical wheat stock that bread makers can ignore. Over a longer period, more wheat production can ease competition between uses, subject to land and growing-time constraints.
Do not confuse composite demand with competitive supply, where producers choose between outputs using shared resources. A higher expected wheat price may induce farmers to plant wheat instead of barley. That increases the attraction of supplying wheat and reduces barley supply. Composite demand concerns wheat's multiple uses; competitive supply concerns allocating inputs between different products.
As a simple illustrative allocation, 100 tonnes of wheat are available. If feed buyers take 35 tonnes rather than 20, only 65 rather than 80 remain for all other uses, before any production or stock response. The 15-tonne reduction shows the resource constraint; it does not calculate a price without demand and supply information.
Derived demand for inputs
Derived demand is demand for an input arising from demand for the output it helps produce. People want journeys, so transport operators demand drivers and vehicles. Households want housing, so builders demand construction labour, bricks and timber. Inputs need not be consumed with the final product by the same buyer.
Higher demand for new housing can raise construction output and the demand for bricklayers. Labour demand shifts right. With labour supply unchanged, there is upward pressure on bricklayers' pay and employment. The employment response is constrained if trained workers are scarce; a higher wage need not immediately produce a large increase in skilled labour supply.
This differs from joint demand: demand for petrol accompanying car use is a consumption complement link; demand for factory workers producing cars is derived from car output demand. The same good can participate in different links depending on the use being examined.
The chain is conditional on firms actually expanding output and on production methods. If firms meet higher demand from stocks, input orders may respond later. If new technology allows the same output with fewer workers, final demand can grow while demand for a particular kind of labour falls. State the technology and output assumptions rather than declaring that every demand increase raises every input demand.
A demand shock can travel both ways: reduced restaurant demand cuts meal production, reducing derived demand for ingredients and staff. Lower input prices may then soften restaurants' costs, feeding back into the original market. A complete causal explanation identifies the input relationship, the shifted curve and the agents responding at each stage.
Joint supply and by-products
Joint supply occurs when producing one product also produces another. Processing cattle yields beef and hides. Refining crude oil produces several petroleum products. Unlike competitive supply, expanding one joint output can increase another output rather than diverting resources away from it.
If beef demand increases, its price and output rise in the ordinary market model. More cattle processing can generate more hides. At each hide price more hides are available, so hide supply shifts right. With hide demand unchanged, the hide price falls and hide quantity rises. Beef and hide prices therefore need not move in the same direction.
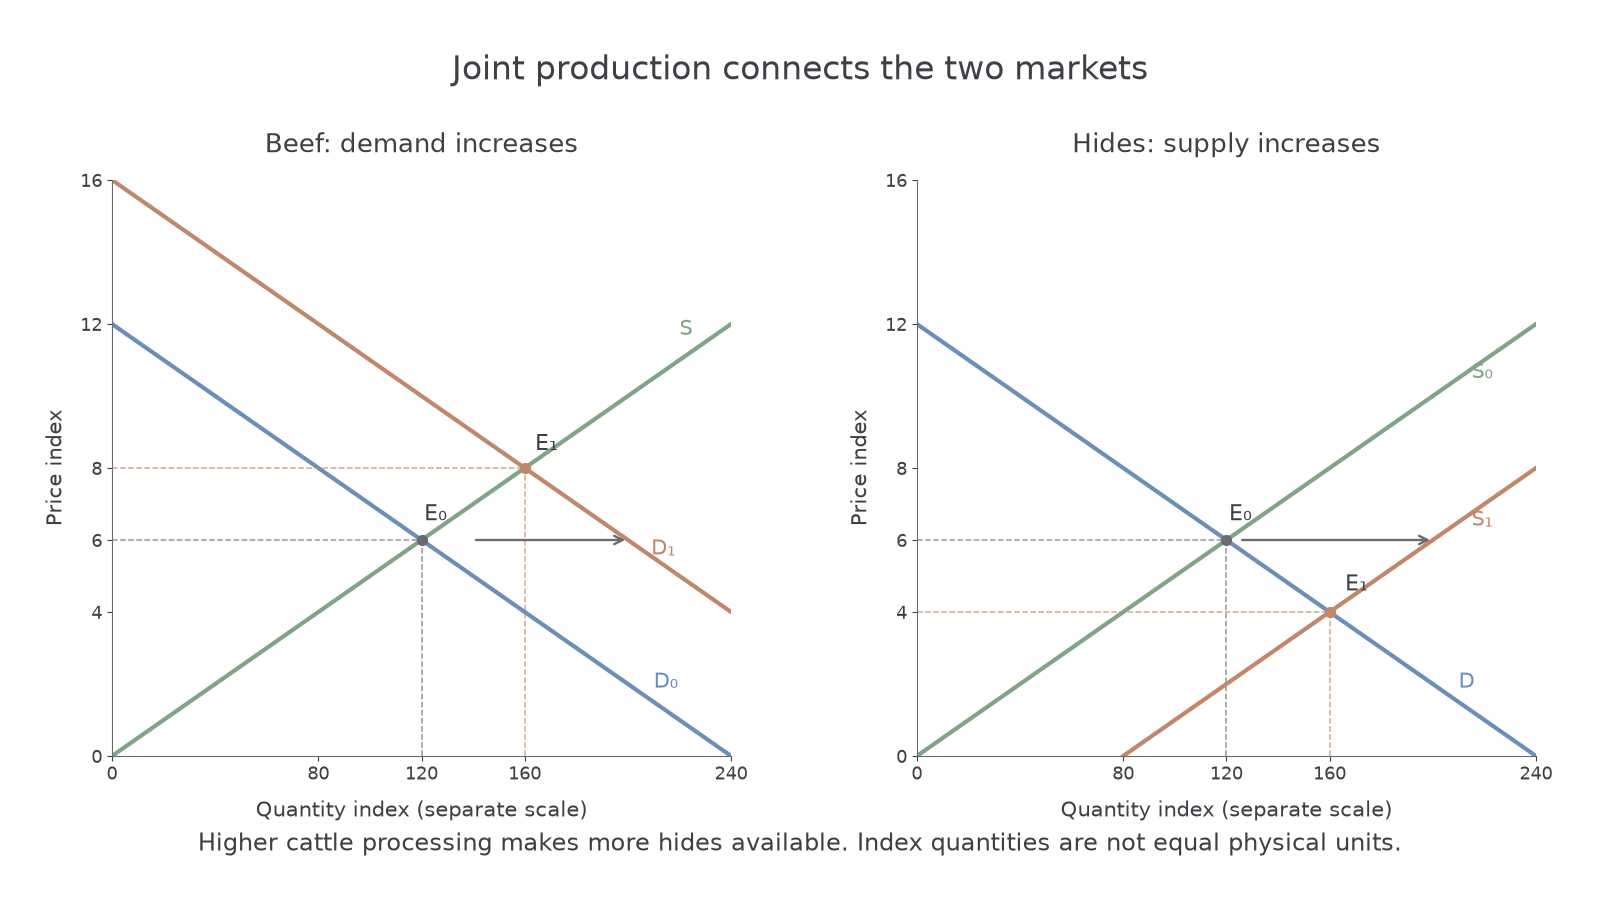
The illustrative left market moves from E₀ to E₁ as beef demand increases. The right market then moves from E₀ to E₁ as hide supply increases. Quantities in each graph have their own units and scales; do not equate the two output changes just because the diagrams are adjacent. The example assumes the production link operates and firms can expand processing.
On paper, construct two separately labelled price–quantity graphs. Keep beef supply fixed and shift beef demand right; keep hide demand fixed and shift hide supply right. Mark old and new intersections in each, and explain in words how higher cattle processing connects them. The second shift is caused by the production relationship, not by the hide-price fall.
Production proportions and waste matter. A low hide price may lead firms to discard hides or search for other uses, and technology can change which by-products are recovered. Joint supply is a physical/economic link under the specified production process, not a claim that all outputs always have identical quantities or equal values.
Tracing wider market transmission
A wider economic issue can contain several different market links, so select a model for each step and keep predictions conditional. Consider an illustrative rise in the delivered price of imported electric cars. If domestically produced electric cars are close substitutes, demand for them may increase. More domestic production may raise derived demand for battery components and skilled labour. But if total electric-car purchases fall, demand for complementary charging services may weaken. The direction of charging demand depends on total adoption and use, not only the nationality of the car producer.
A dated real policy starting point is the European Commission's 12 January 2026 statement on battery-electric vehicle price-undertaking guidance. It describes guidance for possible alternatives in the context of the duties on imports from China introduced in October 2024. This establishes the policy context on that date. The substitution, input-demand and charging-service effects above are model-based possibilities, not outcomes established by that statement or a claim about the latest agreement.
There can be microeconomic and macroeconomic dimensions. An individual industry's higher component cost can reduce its supply; if a similar cost shock affects many industries, widespread price pressure and reduced production may emerge. Reduced output can lower derived labour demand across firms, contributing to economy-wide employment effects. One small market's output change alone does not establish a change in overall inflation or unemployment: scale, offsets elsewhere and other shocks matter. Aggregate models later in the course examine those further steps.
Use a disciplined sequence: identify the initial change; explain the first market's price and quantity; name the relationship to the next market; decide whether its demand or supply shifts; explain its new price and quantity under stated conditions. Differentiate an input-cost link from a consumption-complement link and a change in overall demand from a reallocation between suppliers. Evidence about one market cannot replace evidence about the next.
For a quantitative illustration, a factory initially buys 2 battery modules per electric vehicle and produces 1,000 vehicles per month, requiring 2,000 modules. If output rises to 1,250 with the technique unchanged, demand for modules for that production becomes 2,500: 500 more. If a redesign reduces modules per vehicle, the derived demand need not rise in that proportion. Calculating the input requirement does not establish the new module price without module-market conditions.