3.1.4.5 - Economies of scale and efficient firm size
Learn why expanding a firm can reduce or increase its cost per unit, and why growth of an industry can affect even a small producer. Use long-run average cost to explain efficient firm size, industry structure and barriers to entry.
Internal and external economies
An economy of scale is a fall in long-run average cost associated with a larger scale of production. In the long run all factor inputs can change, so expansion might involve a larger factory, more machinery and additional workers. This differs from adding workers to an unchanged factory in the short run.
Internal economies of scale arise from the growth of the individual firm. They are available because that firm becomes larger, even if the rest of the industry does not grow.
| Internal economy | How a larger firm can reduce cost per unit |
|---|---|
| Technical | A high-capacity machine may produce more units per hour without a proportionate increase in operating cost. A larger operation can also support specialised production stages. |
| Managerial | A specialist purchasing manager can improve buying decisions across a large volume of output; the salary is spread across more units. |
| Purchasing | Bulk orders can secure lower input prices through discounts or bargaining power. |
| Financial | A lender may regard a large, diversified firm as less risky and offer a lower interest rate, reducing its finance cost per unit. This is a possibility, not a rule that every large firm borrows cheaply. |
| Marketing | A campaign's cost can be spread across more sales. |
External economies of scale arise from growth of the industry or its surrounding network, rather than the firm's own expansion. A cluster of food producers might attract packaging suppliers and a college offering relevant training. Each producer can obtain inputs or trained workers more cheaply, including firms that have not expanded. Shared infrastructure and useful knowledge exchanged between firms can have similar effects.
The test is the source of the saving. A firm training its own workforce as it expands is internal; a growing local industry creating a pool of trained workers is external. “External” does not mean “abroad”, and an external economy of scale is not the same definition as an external benefit imposed on a third party.
Why scale can raise average cost
Growth can make an organisation harder to coordinate, raising its long-run cost per unit. These internal diseconomies of scale explain why a larger firm need not be a cheaper producer.
A longer management hierarchy can delay or distort information. A fault reported by a worker passes through several managers before someone authorises a repair, leaving expensive equipment idle. Coordination becomes harder when production sites depend on one another: a late component delivery can interrupt several plants. Monitoring can also become weaker. Managers may pursue their own departmental targets, while workers who feel remote from decisions may lose motivation. More errors, duplicated tasks or lower productivity raise the resources needed for each unit of output.
These mechanisms are not unavoidable. Delegating decisions to smaller teams, reliable information systems and better incentives may allow expansion without higher unit costs. Economies and diseconomies can operate simultaneously; the shape of average cost shows their net effect.
Industry growth can also create external diseconomies. Firms competing for limited specialised workers may bid up wages, while congestion delays deliveries. An unchanged firm's cost curve can rise because the industry around it has expanded. Distinguish these from an individual firm's coordination problems.
Do not explain long-run diseconomies by saying “capital is fixed, so extra workers crowd the factory”. That is a short-run diminishing-returns argument. In the long run the firm can enlarge the factory; the relevant problem is whether managing and coordinating the enlarged operation increases unit cost.
Returns to scale and unit costs
Returns to scale describe a physical input-output relationship, whereas economies of scale describe a cost-output relationship. They are connected, but they are not interchangeable definitions.
Suppose a firm doubles every input while technology and all input prices stay unchanged. Total cost then doubles. If output more than doubles, the cost increase is spread over a still larger output and average cost falls: increasing returns to scale generate economies of scale under these assumptions. Constant returns leave average cost unchanged, while decreasing returns raise it.
In an original illustrative factory, inputs initially cost £100,000 and produce 10,000 units, so average cost is £10. Doubling all inputs costs £200,000:
| New output | Returns to scale | New average cost |
|---|---|---|
| 25,000 | Increasing: output rises by more than 100% | £8 |
| 20,000 | Constant: output rises by 100% | £10 |
| 16,000 | Decreasing: output rises by less than 100% | £12.50 |
The comparison holds input prices constant to isolate the production relationship. If expansion secures cheaper inputs, average cost might fall even with constant physical returns to scale. Conversely, higher wages caused by competition for workers could offset productivity gains. Always state whether the explanation comes from physical productivity, input prices, or both.
Reading long-run average cost
The long-run average cost curve shows the lowest average cost achievable at each output when the firm can choose all its inputs and plant size. Each point assumes an appropriate production arrangement; it is not the cost of forcing every output through one fixed factory.
On a U-shaped LRAC, the downward section shows net economies of scale, the minimum shows the lowest unit cost, and the upward section shows net diseconomies. Moving along it means changing the firm's scale with technology and relevant input-price conditions held constant. A new technology or an external economy affecting production conditions can instead shift the curve down.
An L-shaped LRAC falls and then becomes approximately horizontal. Scale economies are exhausted, but diseconomies do not become significant over the illustrated range. Flexible organisation may prevent the upward section. The curve does not mean total cost becomes constant: if average cost stays at £10, producing twice as much still doubles total cost.
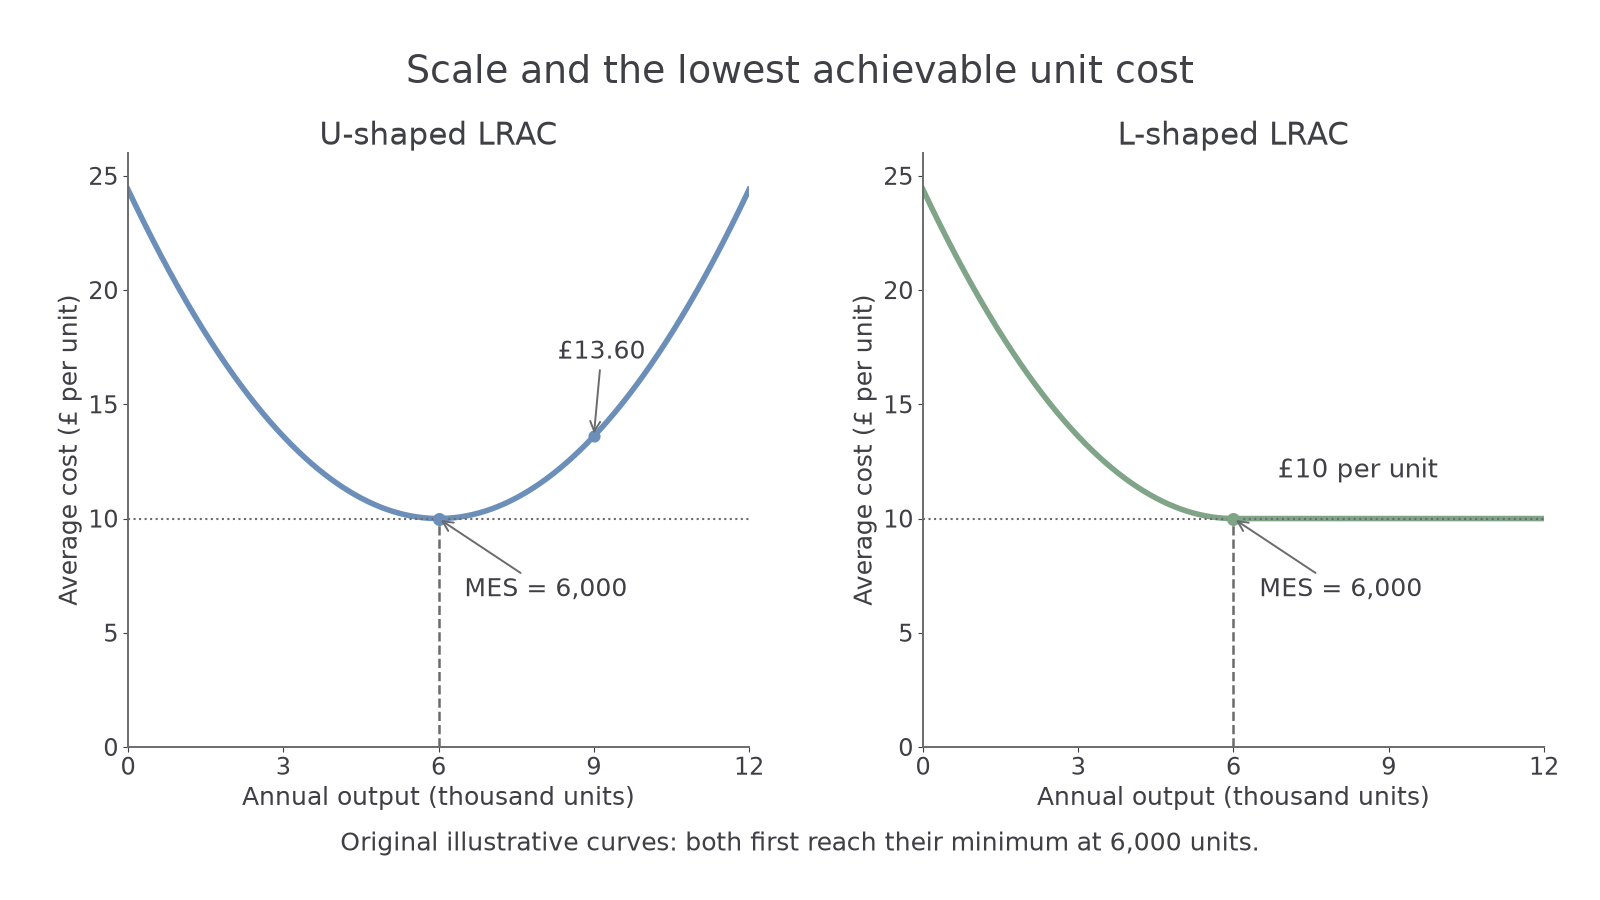
These are original illustrative curves. Both have a lowest unit cost of £10 at 6,000 units. In the U-shaped case, expansion to 9,000 units raises cost to £13.60; in the L-shaped case it remains £10. The minimum efficient scale (MES) is the smallest output at which the lowest long-run average cost is reached. On a flat-bottomed curve it is the start of the flat section, not its far end.
To construct a notebook diagram, put output on the horizontal axis and cost per unit on the vertical axis. Draw the falling region first, then either a rising region or a horizontal continuation. Mark MES vertically beneath the first point at the minimum. Label the curve LRAC and explain the economic reason for each region. A text explanation can establish that you understand the curve; it does not establish drawing performance.
Efficient scale and industry structure
Minimum efficient scale matters relative to the size of the market, rather than as an isolated number. If annual market demand is 18,000 identical units and MES is 6,000, the market could support roughly three firms operating at that scale. If demand is 180,000 at the same MES, many more efficient firms could coexist. This division is a model-based indication, not a prediction of the exact number of firms: prices, differentiated products and changing demand also matter.
A high MES relative to market demand can create a barrier to entry. A newcomer selling only 1,000 units may face a higher average cost than established firms selling at least 6,000. Matching their scale may require substantial finance and winning a large share of the market. A low-price response from an established firm can make this cost disadvantage more difficult to overcome. Entry may therefore be discouraged even without a legal ban.
Large MES can favour a concentrated industry, but it does not prove that every incumbent is protected. An entrant may introduce a cheaper small-scale technology, attract different customers or access finance. An L-shaped LRAC also allows firms of quite different sizes to share the same minimum average cost once they reach MES. More output beyond MES need not provide a further unit-cost advantage.
This gives a conditional explanation of industry structure: ask how much demand must be served to reach low cost, what resources entry requires, and whether the technology allows a small entrant to escape that disadvantage. Do not infer market power simply from a firm's absolute size.
Quick Recap
Internal economies follow the firm's expansion; external economies follow industry growth. With unchanged input prices, increasing physical returns lower unit cost. LRAC records the net effect of scale economies and diseconomies, while MES helps explain entry conditions relative to market size.