3.2.3.1 - Economic growth and the economic cycle
Learn how actual output differs from productive capacity, how an economy moves through an irregular cycle, and why the source and sustainability of growth matter for households, firms and the environment.
Actual and potential growth
Short-run economic growth is an increase in actual real output; long-run growth increases the economy's productive capacity and its underlying trend output over time.
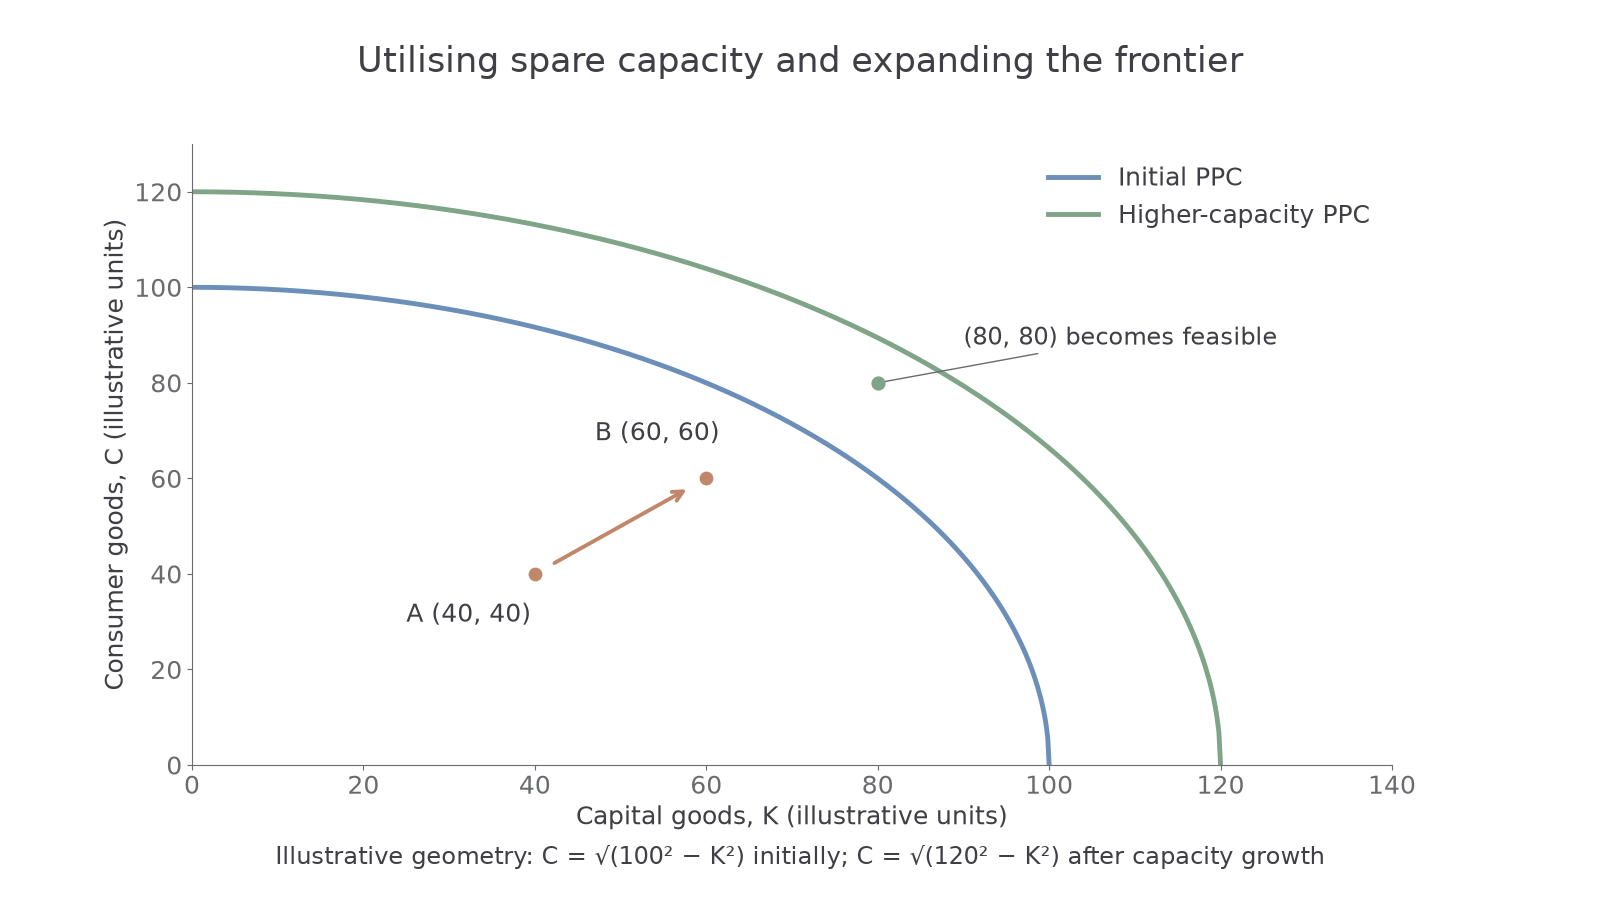
An economy can produce more by using idle workers and equipment without having more resources or better technology. On a production possibility curve (PPC), this is movement from an interior point towards the existing frontier. An outward shift of the frontier represents increased potential production. A movement between two points on the same frontier reallocates output and does not by itself establish an increase in total productive capacity.
The illustrative PPCs below use and , where and are quantities of consumer and capital goods. A at (40,40) and B at (60,60) are both inside the initial frontier: moving A→B increases both outputs through greater utilisation. The outward frontier makes combinations such as (80,80) feasible that were initially beyond capacity. These equations specify the teaching diagram; they do not estimate a real economy.
In AD/AS analysis, stronger aggregate demand can increase actual output where spare capacity exists. The short-run panel uses illustrative curves , and . A rightward AD shift raises equilibrium real output from 80 to 90 and the price index from 100 to 110. It does not shift the potential-output line at 100. The long-run panel instead shifts vertical LRAS from 100 to 120; with illustrative AD , full-capacity output rises and the equilibrium price level falls from 100 to 80, assuming prices/wages adjust and AD is unchanged.
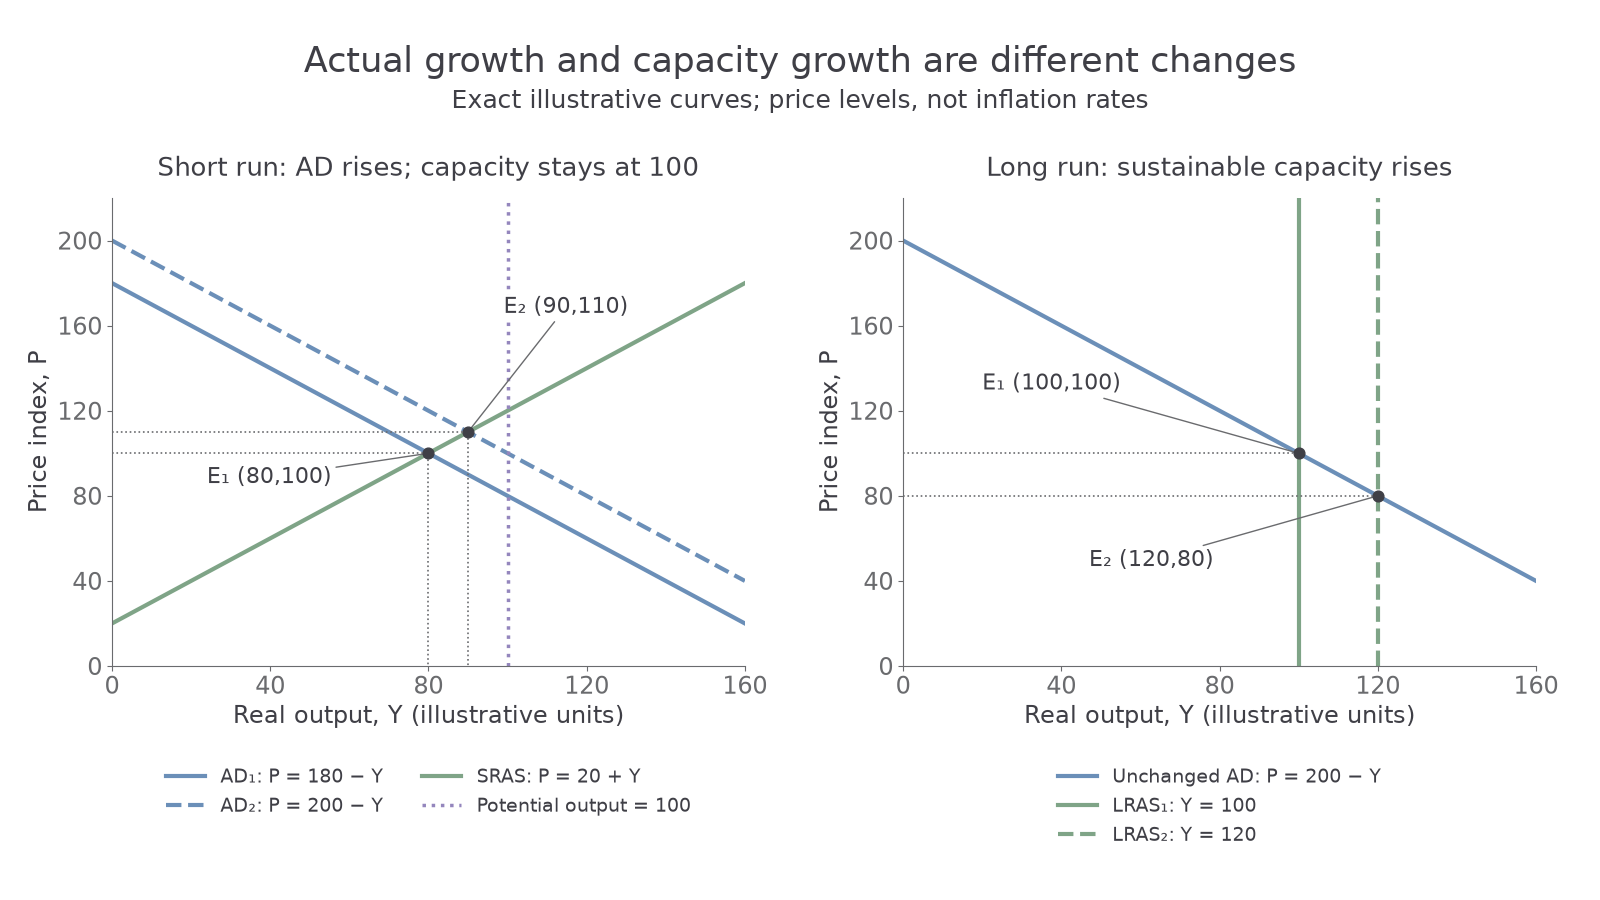
For notebook construction, label PPC quantities separately from AD/AS real output and the price level. Show the initial position, the relevant movement or shifted curve, then the new feasible set or intersection. Keep AD/AS price levels distinct from inflation rates. A rebound after a recession can be rapid because spare capacity is being reused, without an equally rapid improvement in the long-run trend.
Demand and supply determinants of growth
Demand determines how much of existing capacity firms want to use, while supply conditions determine what the economy can produce and at what cost.
Consumption, investment, government spending or net exports can raise AD. For example, stronger overseas demand increases export orders; firms expand production and hire workers, whose incomes can support further spending through the multiplier. The effect on real output is larger when resources are underused. Near capacity, more spending may mainly raise prices or imports. A rise in the money value of GDP caused by inflation is not real growth.
Lower input costs or greater productivity can shift short-run AS right, supporting more output at a lower price level. Lasting increases in productive capacity depend on the quantity and quality of resources: capital investment, education and training, technological progress, infrastructure, enterprise, factor mobility and effective institutions. Reliable access to investment finance can help firms adopt more productive methods; poor incentives, weak property rights or financing constraints can hold investment back.
Investment illustrates a micro/macro link. A firm's new machine creates spending demand while it is installed and can later raise output per worker, reduce unit costs and expand the economy's capacity. A rise in demand alone is not an automatic permanent shift in LRAS. Nor does the same amount of spending guarantee the same capacity gain: skills, maintenance, complementary infrastructure and project quality matter. Population growth can raise total potential output while producing little growth in potential output per person.
The trend rate of growth is the underlying growth of potential real output across years, not the growth rate in one recovery quarter. Sustained productivity improvements can raise this trend. Temporarily adding overtime may lift actual output above normal capacity but cannot be maintained indefinitely.
The cycle and output gaps
The economic cycle describes fluctuations of actual economic activity around its underlying trend; its phases differ in length and strength.
During expansion or recovery, output rises, investment often strengthens and cyclical unemployment tends to fall. A boom has unusually strong activity and may strain capacity. In a downturn output growth weakens and can become negative; investment and hiring often fall. A trough is the low point before recovery. A common operational definition of recession is two consecutive quarters of falling real GDP, but wider evidence helps assess the depth and character of a downturn.
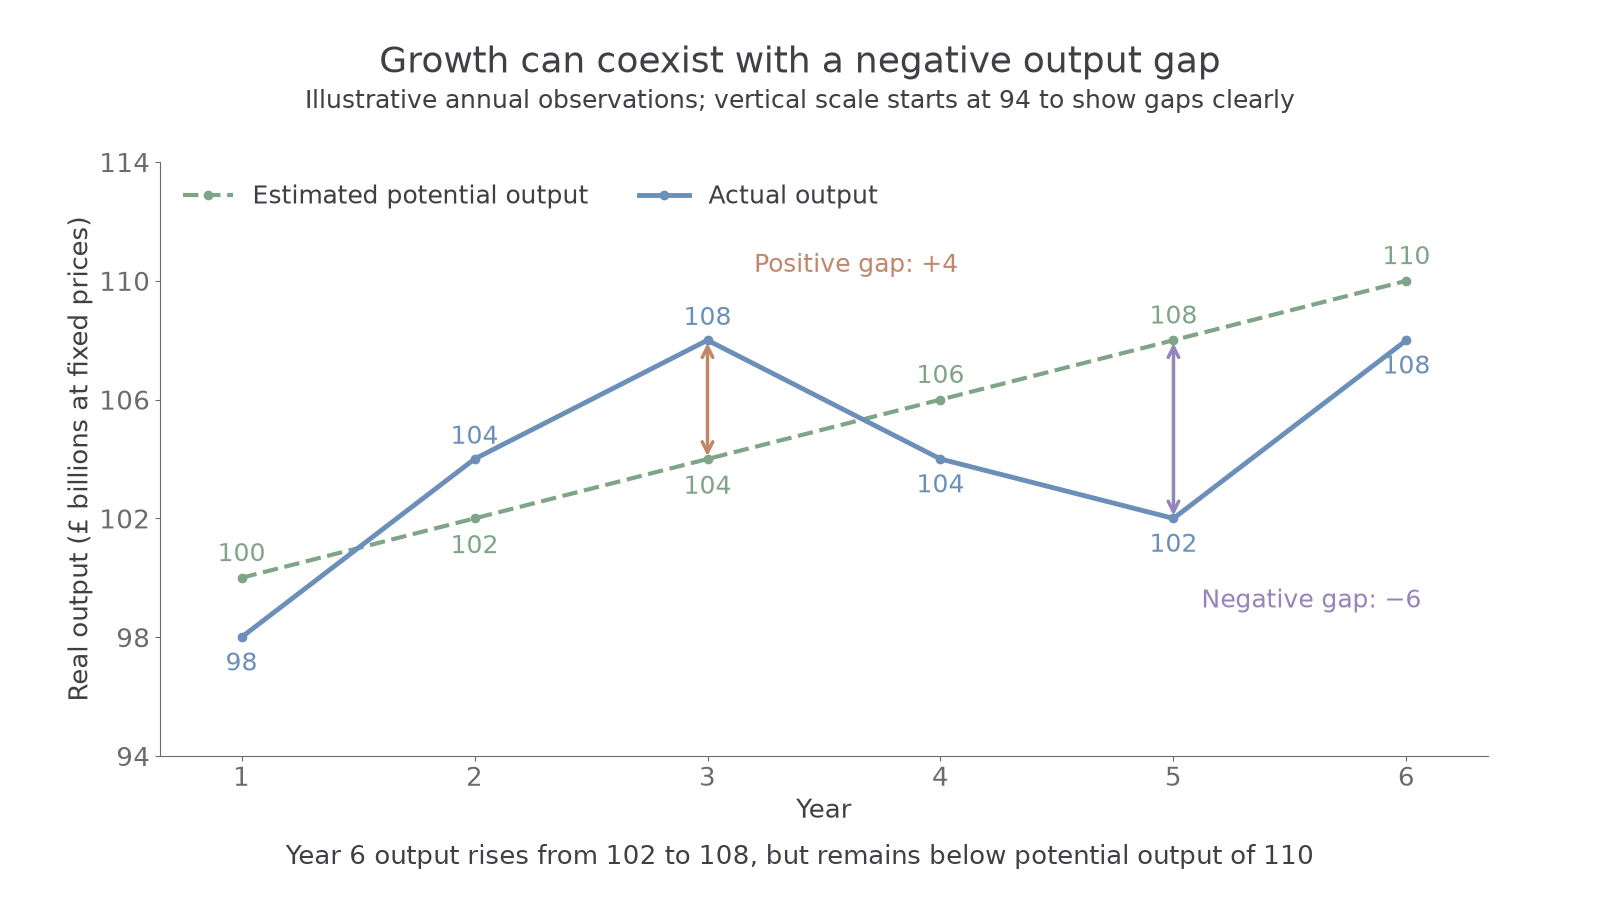
An output gap compares actual GDP with estimated sustainable potential GDP. It is negative when actual output is below potential, and positive when actual output is above potential. “Potential” means normal sustainable capacity, not the absolute maximum that could briefly be achieved with excessive overtime. A positive gap can therefore exist. It tends to create inflationary pressure; a negative gap is associated with underused resources and cyclical unemployment.
The following illustrative series shows actual output and potential output separately, in £ billions at fixed prices.
Continue this lesson.
You’re previewing NovaLearn without an account. Create a free account to read the rest.
Create free account