3.1.5.10 - Static and dynamic efficiency
Learn how to distinguish low production costs, an efficient output mix and improvement over time. Apply these benchmarks to firms with different market structures, using evidence about behaviour and performance rather than assuming that a market label determines the result.
Static efficiency benchmarks
Static efficiency asks how well resources are used with the technology and preferences available at a given time.
Productive efficiency means producing at the lowest feasible average total cost. For the standard firm cost curve, the minimum of AC is where MC crosses AC from below. Below that output, an extra unit costs less than the existing average and pulls it down; above it, MC exceeds AC and pulls the average up. Producing more is therefore not automatically more productively efficient. At the economy-wide level, a point on the production possibility boundary means resources are not being wasted, but it does not by itself identify society's preferred output mix.
Allocative efficiency means resources produce the output mix consumers value relative to its opportunity cost. In the standard product-market model, the condition is price = marginal cost. Demand price represents the value of the next unit to buyers; MC represents resources sacrificed to produce it. If price exceeds MC, extra units would add more benefit than cost and output is too low. If price is below MC, the last units cost more than buyers value them and output is too high.
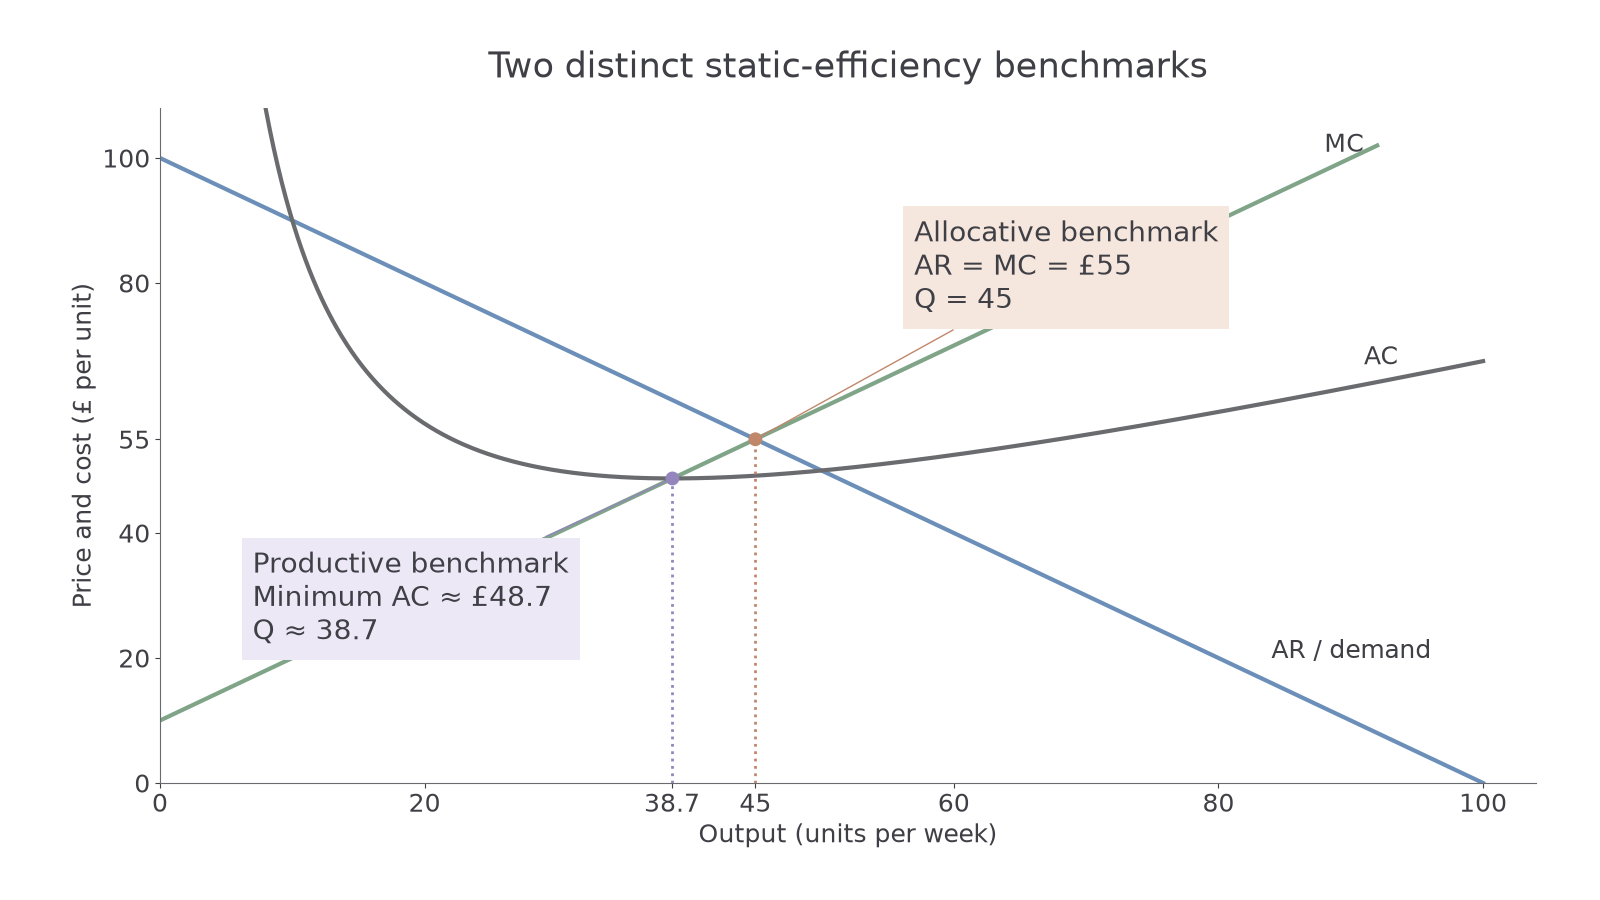
In this original illustrative graph, output is units per week and the vertical scale is pounds per unit. AC has a minimum of about £48.7 at 38.7 units, where MC crosses it. AR represents demand and intersects MC at 45 units, price £55. These are distinct benchmarks: the minimum-cost output does not necessarily equal the quantity buyers value at its marginal cost. The labels show what each condition tests; they are not two alternative profit-maximising rules. A single-price monopolist with this demand instead chooses MR = MC at 30 units, as in the monopoly lesson.
The social interpretation requires assumptions. There must be no unpriced external benefits or costs, and the demand/cost information must correctly represent benefits and opportunity costs. With pollution, private MC understates social MC, so price = private MC need not maximise social welfare. Demand also reflects ability to pay; an allocatively efficient outcome in this model is not automatically a fair distribution.
Notebook construction: label the axes, draw a coherent AC and MC pair with MC crossing AC at its minimum, and mark that productive benchmark. Add demand/AR and mark its separate MC intersection for the allocative benchmark. Read output from the horizontal axis and cost/price from the vertical axis. The supplied graph permits graded interpretation; drawing on paper is practice.
Dynamic efficiency
Dynamic efficiency concerns improvements in products, production and resource allocation over time.
Research and development can discover a better product or process; applying it commercially can improve quality or reduce inputs needed per unit. Investment in human capital, such as training, can let workers use technology effectively and make fewer errors. Investment in non-human capital, such as equipment or software, can raise capacity and productivity. Technological change may shift cost curves downward or expand the range of useful products. Expenditure alone is not proof of improvement: failed research, unsuitable equipment or poor training may deliver little benefit.
Continue this lesson.
You’re previewing NovaLearn without an account. Create a free account to read the rest.
Create free account