3.1.6.3 - Competitive wages and employment
Learn how labour demand and supply determine a competitive wage and employment, why wages differ between occupations, and how the model helps interpret imperfect real markets.
A market wage balances demand and supply
In a perfectly competitive labour market, no individual employer or worker can control the market wage.
The model assumes many employers and workers, comparable labour within the defined market, good information, mobility and no barriers that stop workers or firms responding. Employers take the wage as given and choose employment; workers choose whether to offer labour at that wage. These assumptions describe a benchmark, rather than every real workplace.
At equilibrium, the quantity demanded equals the quantity supplied. If wages are too low, employers want more workers than are available. Competition to recruit creates upward pressure on wages. If wages are too high, more people offer labour than employers want to hire, creating downward pressure. This adjustment presumes flexible wages and effective competition.
The original illustrative graph uses demand and supply , with wages in pounds per hour and in worker-equivalents offering the same hours. Their intersection E is £16 and 80. At £12, demand is 100 while supply is 40: a shortage of 60. At £20, demand is 60 while supply is 120: an excess supply of 60. Equilibrium employment is 80, not the amount supplied at some higher proposed wage.
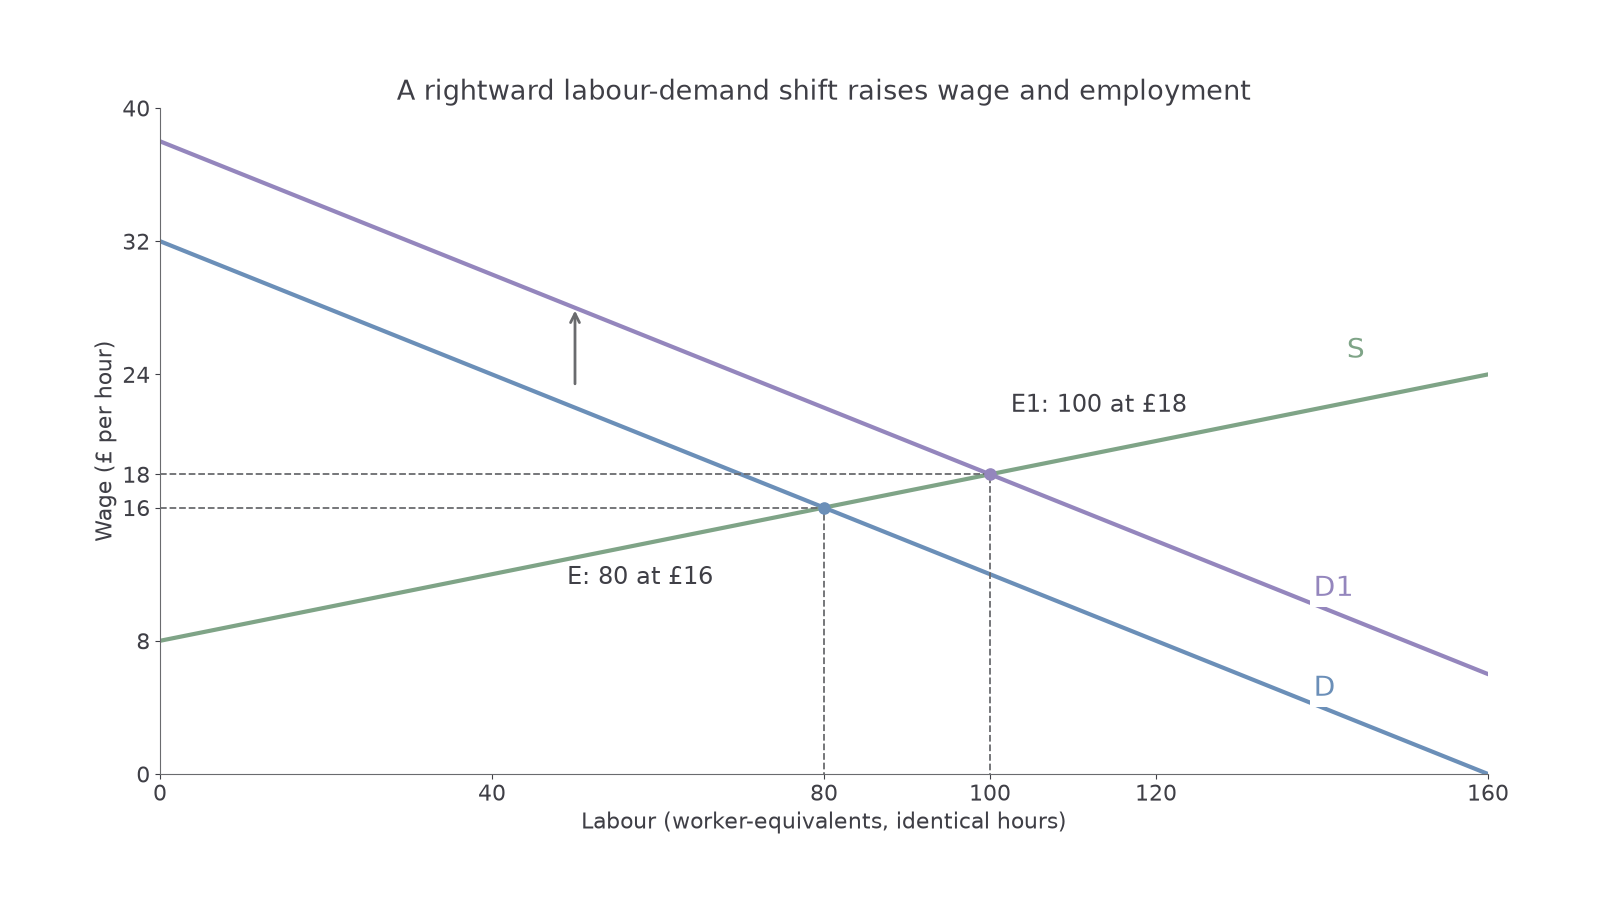
Draw this model on paper by labelling the wage and employment axes, placing downward demand and upward supply, and projecting their intersection to both axes. The text questions assess your interpretation and reasoning; drawing practice develops a separate skill.
Changes in demand or supply change the outcome
A shift changes equilibrium because demand and supply no longer match at the original wage.
In the graph, additional demand for the occupation's output shifts labour demand from D to D1 while supply stays fixed. At £16, employers now want 110 workers but only 80 offer labour. The shortage bids wages up. The new equilibrium E1 is £18 and 100. Wage and employment both rise; the increased quantity supplied is a movement along the unchanged supply curve.
Calculate percentage changes with the original value as denominator:
The wage increase is £2 per hour, while employment increases by 20 worker-equivalents. Those absolute changes are different from the percentage changes. A percentage-point change is used when comparing rates already expressed as percentages, not these wage levels.
A rightward supply shift, with demand unchanged, instead lowers wages and increases employment. At the original wage there is now excess supply. A fall in the wage encourages more hiring and reduces the quantity offered along the new supply curve. A leftward supply shift raises wages but reduces employment. A leftward demand shift reduces both.
Continue this lesson.
You’re previewing NovaLearn without an account. Create a free account to read the rest.
Create free account