3.1.3.1 - Demand and its determinants
Learn what a demand curve holds constant, why a price change causes a movement along it, and how changes in consumers' circumstances shift the whole curve.
Effective demand
Demand measures purchases consumers are willing and able to make at different prices during a specified period.
Effective demand combines willingness with purchasing power. Wanting an expensive bicycle without being able to pay for it is a desire, but does not count as effective demand at that price. Quantity demanded is the amount consumers would buy at one particular price. Demand is the whole price–quantity relationship, rather than one number of purchases.
Specify the product, market and period. Demand for bus journeys per week is different from demand for bus tickets per year. A fall in weekly purchases could reflect a higher ticket price, fewer commuters or unreliable service; the quantity alone does not identify which relationship changed.
An individual's demand records that person's planned purchases. Market demand adds the quantities demanded by all consumers at each common price. In this original illustrative market, two households' weekly demand for bags of coffee is:
| Price per bag | Household A | Household B | Market quantity per week |
|---|---|---|---|
| £6 | 1 | 1 | 2 |
| £4 | 2 | 3 | 5 |
| £2 | 3 | 5 | 8 |
At £4, add quantities horizontally: bags per week. Do not add the prices. These are planned purchases under the stated conditions, not proof that suppliers actually sell every bag.
Price and quantity demanded
A demand curve isolates the effect of the product's own price by holding other influences constant.
The law of demand states that, other things equal, a lower price normally raises quantity demanded and a higher price lowers it. A lower price makes the product cheaper relative to alternatives, encouraging substitution towards it. It also allows a given money income to buy more: purchasing power increases. These mechanisms explain the usual downward slope; they do not imply every consumer buys more in every circumstance.
Ceteris paribus here holds income, tastes, other prices and other demand influences constant. A price fall causes an extension of demand, a movement down the existing curve; a price rise causes a contraction of demand, a movement up it. The curve itself does not shift when only its own price changes.
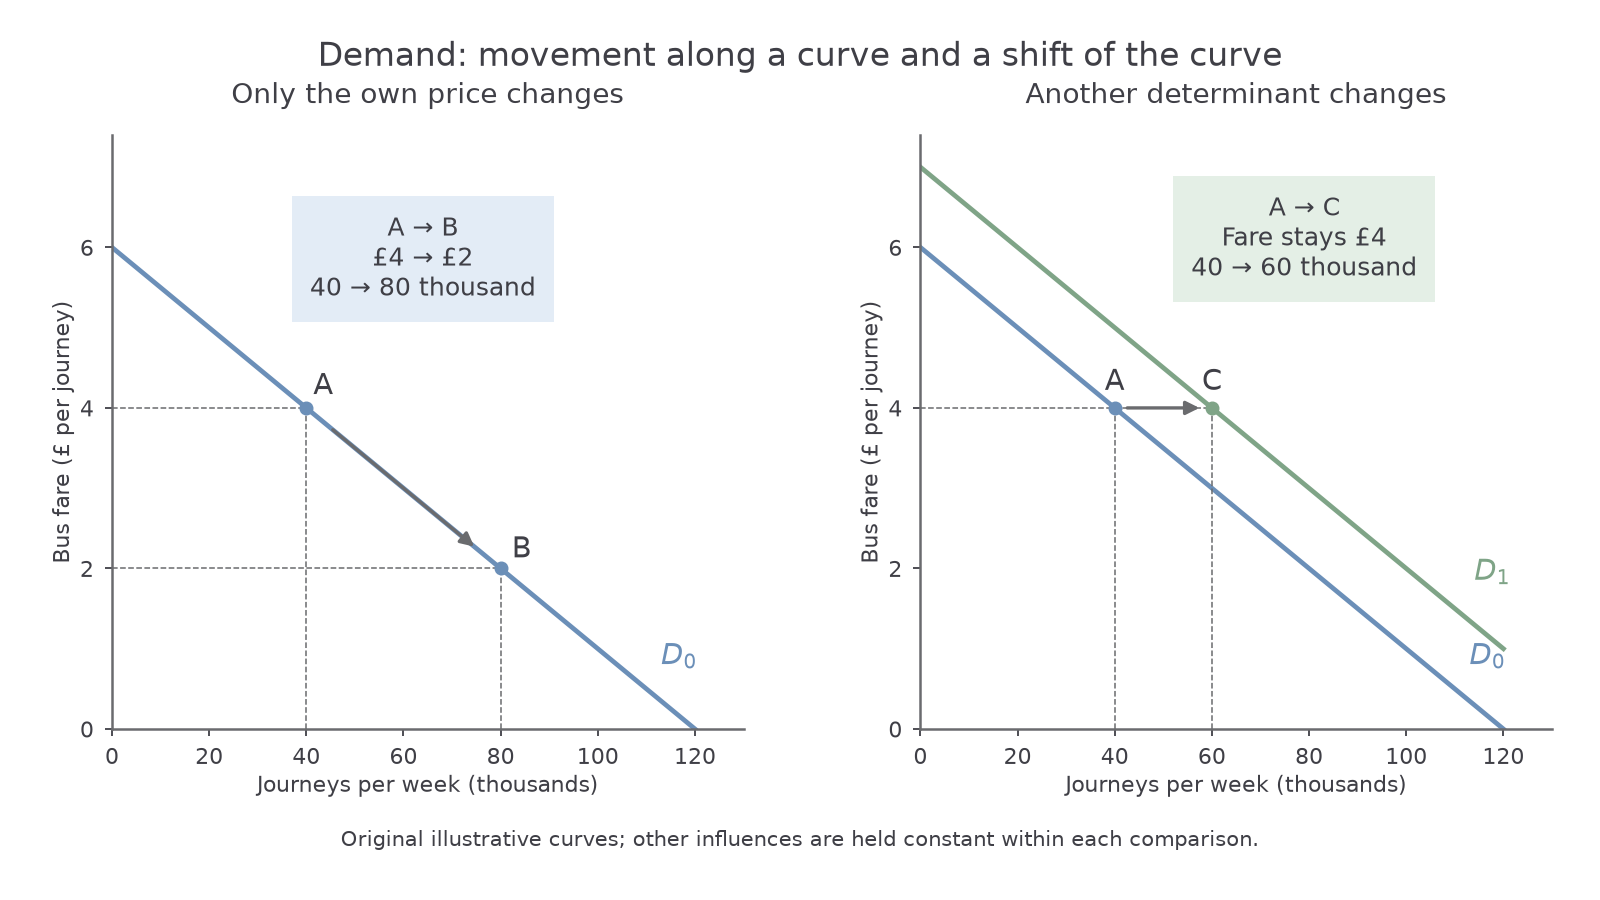
In the left panel, bus fares fall from £4 to £2 and planned journeys rise from 40 to 80 thousand per week: A to B on . Read price on the vertical axis and quantity on the horizontal axis. The dashed lines locate each coordinate; they are not extra demand curves. The right panel will distinguish a change in demand at a constant price.
To construct a demand graph in a notebook, label both axes with units and the period, choose a consistent scale, plot each supplied price–quantity pair with quantity first, and join the points according to the stated relationship. Label the curve . Here the illustrative schedule is a straight line; real demand need not be linear. Use arrows to identify the movement, rather than moving the whole line. This paper practice develops construction; the text questions assess interpretation.
Causes of demand shifts
A change in a factor held constant by the original curve changes quantity demanded at each possible own price.
An increase in demand shifts the curve right: more is demanded at a given price. A decrease in demand shifts it left. In the graph's right panel, the fare remains £4 but journeys rise from 40 to 60 thousand per week, A to C. This is a shift from to , rather than an extension along .
| Influence | Mechanism and possible direction |
|---|---|
| Income | More income raises demand for a normal good; it reduces demand for an inferior good as consumers switch to preferred alternatives. The classification concerns the income response, rather than quality. |
| Price of a substitute | Substitutes can serve a similar purpose. A rise in train fares may make bus journeys relatively attractive, shifting bus demand right even if bus fares stay constant. |
| Price of a complement | Complements are used together. A rise in the price of games may reduce demand for the console needed to play them. |
| Tastes, information and advertising | A stronger preference for cycling, perhaps after learning about its benefits, may raise bicycle demand. An advert only shifts demand if it changes willingness to buy. |
| Population and composition | More residents may increase market demand. More school-age residents particularly affect demand for school places. |
| Expectations and seasonal conditions | Expected future price rises may bring forward purchases of storable goods. Hot weather may raise demand for cold drinks. The effect depends on the product and period. |
Choose the affected product first. A rise in coffee's own price contracts coffee quantity demanded; it may simultaneously increase demand for tea if consumers regard them as substitutes. The same event can therefore cause a movement in one market and a shift in another.
Separating demand changes
Observed sales need a causal explanation before you decide whether demand shifted.
Consider this original illustrative café evidence. Initially a coffee costs £3 and consumers plan 200 cups per day. With income and tastes unchanged, a reduction to £2 raises planned purchases to 260. This fits a movement along a fixed demand curve. Later, at the same £2 price, a nearby college opens and planned purchases rise to 330. More potential consumers now want coffee at the given price, so the demand curve shifts right.
The numerical changes are 60 extra cups from the price movement and 70 extra cups at the unchanged price after the college opens. These simple differences describe the evidence. They do not prove the college is the cause: a contemporaneous improvement in coffee quality would also shift demand. A credible comparison would need to distinguish such influences.
When both own price and another determinant change, separate their effects conceptually. If bus fares rise while train fares also rise, the bus-fare increase contracts bus quantity demanded along its curve; the train-fare increase may shift bus demand right. The final quantity can rise or fall depending on the relative sizes. A higher observed quantity does not by itself mean the own-price law of demand has failed.
Likewise, purchases are not always the same as quantity demanded. A sold-out concert can record only available seats even when consumers want more at the posted price. Demand describes willingness and ability; actual sales may be constrained. To explain a demand shift, state the determinant, explain how it changes willingness or ability at a given own price, and identify the curve's direction. Establishing a new market price also requires supply, which is taught separately.
Quick Recap
Demand is a price–quantity relationship for willing and able buyers. Own-price changes move along a curve; changes in other determinants shift it. Always name the market, units, time period and conditions before interpreting a graph or a change in purchases.