3.1.8.9 - Indirect taxes and subsidies
Learn how taxes and subsidies change market incentives, how elasticities divide their effects, and when these interventions improve rather than reduce economic welfare.
Objectives and market incentives
A mixed economy combines market decisions with government influence over resource allocation. Prices give buyers and sellers useful signals, but private incentives may omit external costs, external benefits or the effects of imperfect information. Market failure provides a case for intervention; it does not establish that every intervention will work.
Governments may aim to reduce harmful activity, encourage beneficial consumption, improve access, raise revenue or protect particular groups. These objectives can conflict. A tax designed to reduce consumption may collect less revenue if it succeeds; a subsidy that expands access uses funds that could support another service.
An indirect tax is imposed on spending or production of goods and services. A specific tax is a fixed amount per unit; an ad valorem tax is a percentage of value. A subsidy is a payment that supports an activity. A per-unit producer subsidy changes the reward for each additional unit; a lump-sum grant need not change marginal cost in the same way. Public expenditure, taxation and regulation can also be combined: information or standards may address failures that a price change alone cannot correct.
A tax wedge and incidence
A specific tax on suppliers raises the price they need to receive from consumers at each output, shifting the supply curve vertically upwards by the tax. Demand does not shift merely because the good becomes dearer: buyers move along demand. The new consumer price exceeds the producer's net receipt by the tax.
The exact illustrative market below has inverse demand and supply , with pounds per unit and units per week. Initially , so and . A £20 tax makes consumer-price supply . Now , consumers pay £70 and producers retain £50.
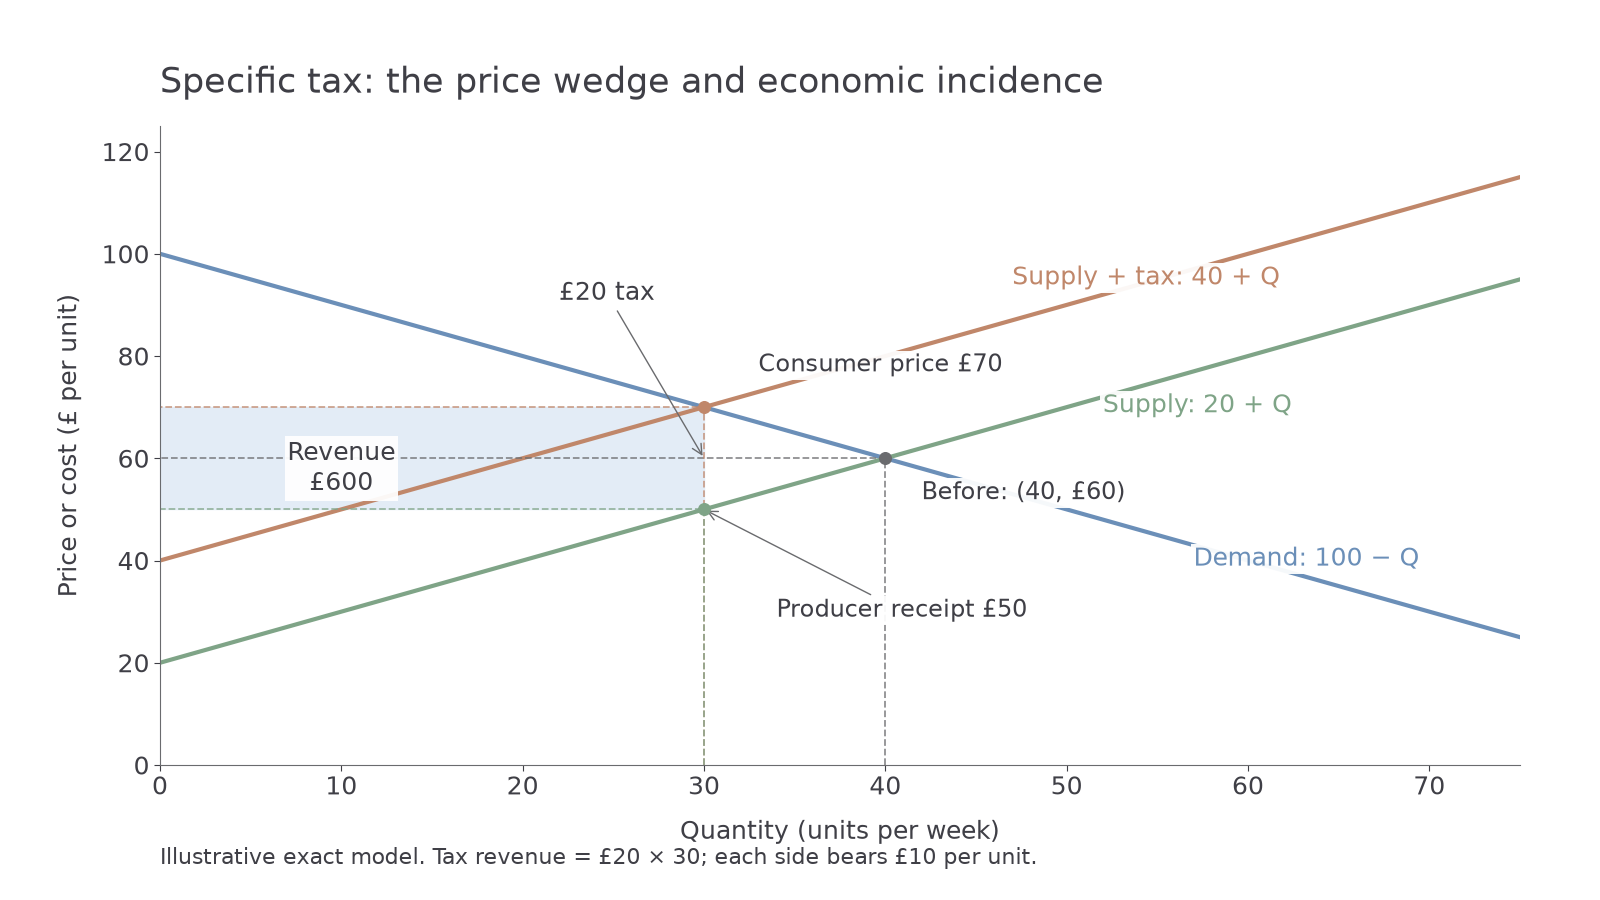
Consumer price rises £10 and producer receipt falls £10. Each side bears half the per-unit economic incidence, even though suppliers send the tax to government. Revenue is the tax times the quantity still traded: per week, the rectangle between £50 and £70 up to quantity 30. It is not £20 times the old quantity.
Relative elasticities determine incidence. The less price-responsive side has fewer alternatives and bears more of the burden. Relatively inelastic demand tends to put more on consumers; relatively inelastic supply tends to put more on producers. A steep line alone is not a universal elasticity measure: scales, starting values and the relative responsiveness of both sides matter. In a market without externalities, the lost beneficial trades create a deadweight loss; a tax does not automatically correct a failure.
To construct this model on paper, label price and quantity axes, draw demand and original supply, then draw the tax-adjusted supply exactly £20 above it at each quantity. Mark the new intersection, trace its quantity down to original supply for the producer receipt, and label the vertical wedge. This avoids placing both prices on the same curve. The online checks assess supplied graphs and explanations; notebook drawing is ungraded practice.
Correcting external costs
A corrective tax can improve allocation when an external cost makes private production excessive. Assume competitive supply represents marginal private cost (MPC), demand represents marginal social benefit (MSB) and the marginal external cost is £20 at every quantity. Then marginal social cost (MSC) is £20 above MPC.
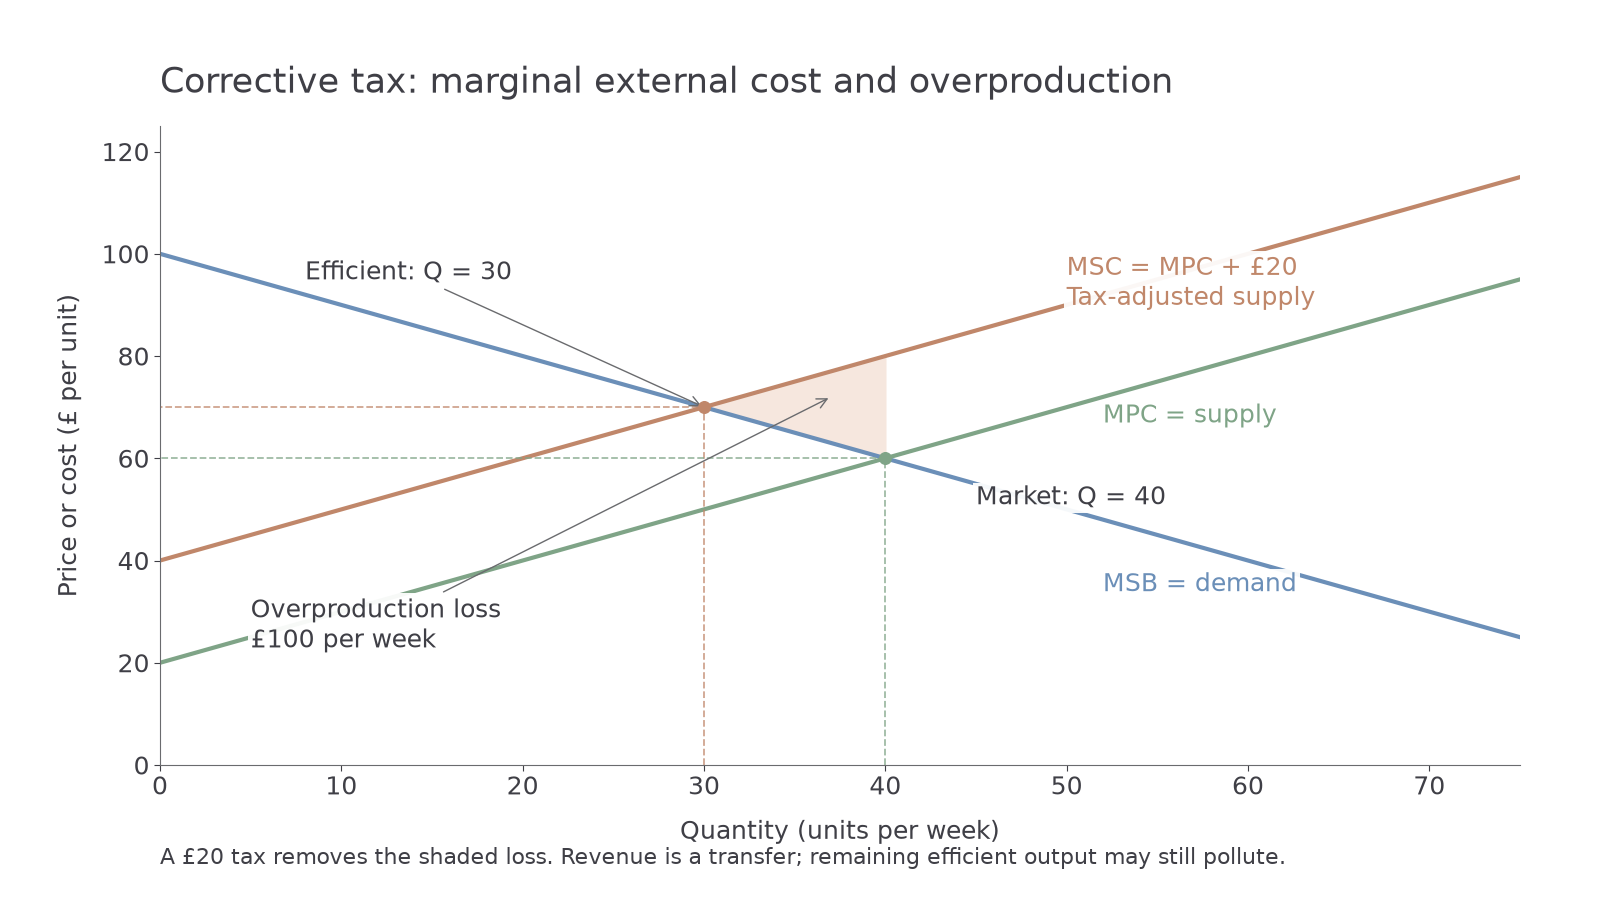
The unregulated market produces 40 units where demand meets MPC. Society's efficient output is 30 where MSB meets MSC. The tax makes suppliers face the full marginal cost of the activity and reduces output to 30. Between 30 and 40, social cost exceeds benefit; the pale triangle is the welfare loss from those excess units, equal here to per week. Avoiding it improves welfare in this model.
Continue this lesson.
You’re previewing NovaLearn without an account. Create a free account to read the rest.
Create free account