3.1.6.1 - Labour demand and marginal productivity
Learn why firms employ labour, how an extra worker's contribution to revenue affects hiring, and why some occupations lose more jobs than others when wages rise.
Demand for workers follows demand for output
Firms normally employ workers because those workers help produce something customers want to buy.
Derived demand means that demand for a factor of production comes from demand for the goods or services it helps produce. A bakery's demand for bakers depends partly on demand for bread. Increased orders make additional production worthwhile, so the bakery may hire more bakers. Falling orders may reduce hiring even if bakers are just as skilled as before.
This is a microeconomic link between the product market and the labour market. It also helps explain a macroeconomic transmission: a broad fall in spending can reduce firms' sales and labour demand across many industries, increasing unemployment. A fall in one industry's employment alone need not imply rising unemployment nationally; workers may move into expanding industries.
The link is conditional. A bakery with spare staff capacity can meet more orders without hiring immediately. A firm might use extra hours, capital equipment or subcontracting. Labour demand concerns the amount firms wish to employ at different wages, not every change in observed employment.
The revenue contribution of an extra worker
The hiring decision compares the extra revenue generated by labour with the extra cost of employing it.
Marginal physical product of labour (MPP) is the additional output from one more unit of labour, holding other inputs constant. Marginal revenue product of labour (MRP) is the additional revenue that this output generates.
Use compatible periods: if MPP is units per additional worker per day and MR is pounds per unit, MRP is pounds per worker per day. In a perfectly competitive product market, the firm sells extra units at the given price, so MR equals price. With product-market power, selling additional output can require a lower price; use marginal revenue rather than automatically using price.
In this original illustrative workshop, output sells at a constant £5 per unit. Other inputs are fixed and the daily wage is £100.
| Additional worker | MPP: extra units per day | MRP: extra revenue per day |
|---|---|---|
| First | 30 | £150 |
| Second | 26 | £130 |
| Third | 22 | £110 |
| Fourth | 18 | £90 |
If the firm can recruit any number of workers at the given wage, the marginal cost of labour equals £100. Employing the first three workers adds more revenue than cost. The fourth adds £90 but costs £100, reducing profit by £10. The best integer choice is three workers. In a smooth model, the profit-maximising boundary is MRP equal to marginal cost of labour: expand while MRP exceeds it, stop before it falls below it.
MRP often falls as employment expands because additional labour has less fixed equipment or space to work with: diminishing marginal returns. This model assumes profit maximisation and a measurable marginal contribution. Team production, uncertainty, training costs and long contracts make that contribution harder to identify in practice.
Wages and the quantity of labour demanded
A labour demand curve shows how much labour firms wish to employ at each wage, with other influences held constant.
Put the wage rate on the vertical axis and employment on the horizontal axis. For a wage-taking firm, a downward-sloping MRP curve is its labour demand curve: a lower wage makes additional workers whose MRP was previously too low profitable to employ. A higher wage excludes workers whose extra revenue no longer covers their cost. Market demand combines firms' demands; product-market adjustments mean it need not be a simple unchanged sum of individual MRP curves.
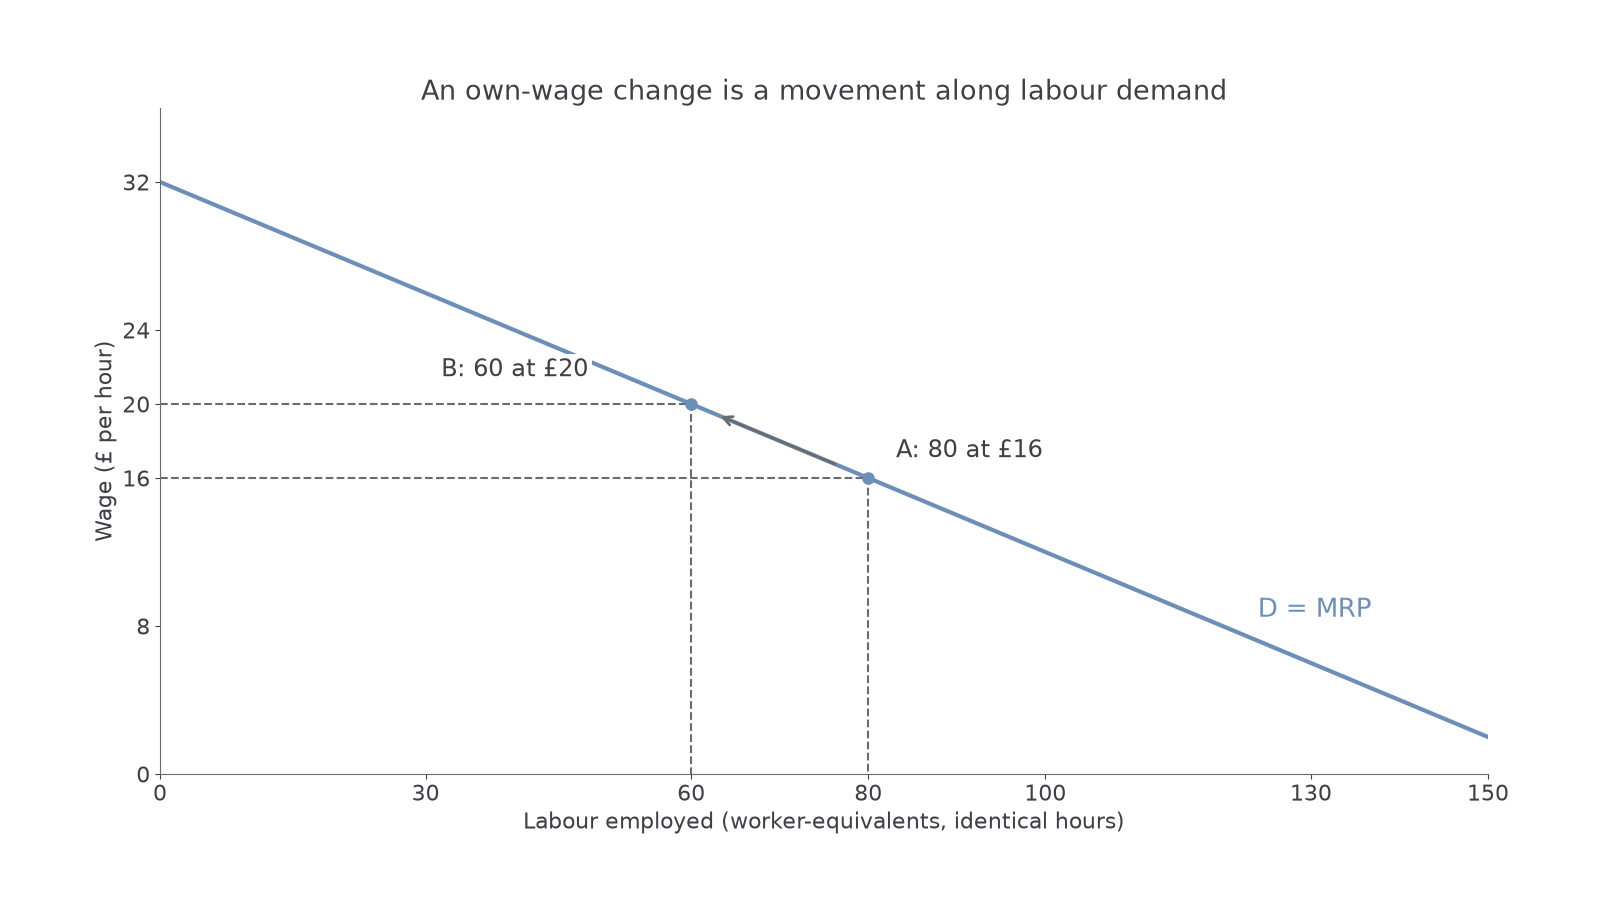
The original numerical graph below uses , where is pounds per hour and is the number of worker-equivalents employed for the same hours. At £16, demand is 80; at £20, it is 60. Raising the wage causes a movement along demand from A to B. It does not shift the curve. These hourly values are separate from the daily workshop example.
Continue this lesson.
You’re previewing NovaLearn without an account. Create a free account to read the rest.
Create free account