3.5.1.3 - Resistivity
Every conducting material resists the flow of charge to some degree, but how do we compare the resistance of different materials fairly, independent of their size and shape? The answer lies in a property called resistivity. In this lesson, you will learn how resistivity relates resistance to the dimensions of a conductor, explore how temperature affects resistance in metals and thermistors, and discover the remarkable phenomenon of superconductivity.
Resistivity and Its Equation
The resistance of a uniform conductor depends on three things: the material it is made from, its length, and its cross-sectional area. Experiments show that for a conductor of length and uniform cross-sectional area :
- resistance is proportional to length:
- resistance is inversely proportional to cross-sectional area:
Combining these gives , where (the Greek letter rho) is a constant for a given material at a given temperature. This constant is the resistivity.
Resistivity
Resistivity is a property of a material that quantifies how strongly it opposes the flow of electric current. It is numerically equal to the resistance of a specimen of that material with length 1 m and cross-sectional area 1 m².
Rearranging the equation to make resistivity the subject gives the form stated in the specification:
Resistivity
Where:
- = resistivity (in )
- = resistance (in )
- = cross-sectional area (in )
- = length (in )
The unit of resistivity is the ohm metre (). Be careful not to confuse this with ohms per metre — it is resistance multiplied by area, divided by length.
It is essential to distinguish between resistance and resistivity. Resistance depends on the size and shape of a particular component. Resistivity is a fundamental property of the material itself — it does not change when you cut a wire shorter or use a thicker piece. For example, copper has a resistivity of at room temperature regardless of whether it is a thin wire or a thick busbar.
The table below shows typical resistivity values at room temperature:
| Material | Resistivity / |
|---|---|
| Copper | |
| Constantan | |
| Carbon | |
| Silicon | |
| PVC |
Notice the enormous range — from for good conductors to for insulators.
For a wire with a circular cross-section of diameter , the cross-sectional area is:
This is frequently needed in resistivity calculations, so always check whether you are given radius or diameter.
Determining Resistivity Experimentally
To measure the resistivity of a wire, you need to determine its resistance, length, and cross-sectional area.
Measuring the cross-sectional area: Use a micrometer to measure the diameter of the wire at several different points along its length, then calculate a mean value. This accounts for any non-uniformity. The cross-sectional area is then .
Measuring resistance for different lengths: Set up a circuit with an ammeter in series with the wire and a voltmeter in parallel across the section of wire being tested. The circuit below shows the standard arrangement, so notice that the ruler lets you measure the chosen length between the crocodile clips while the voltmeter measures the pd across just that test section. Measure the resistance for several different lengths of the wire.
[DIAGRAM: asset_name: 5.1.3 - Resistivity - Diagram 1; asset_slug: 5.1.3 - Resistivity - Diagram 1; recommended_method: retained_png; description: Circuit diagram showing a battery, switch, and ammeter in series with a length of resistance wire on a ruler. A voltmeter is connected in parallel across the wire between two crocodile clips. Labels show length L measured along the ruler.]
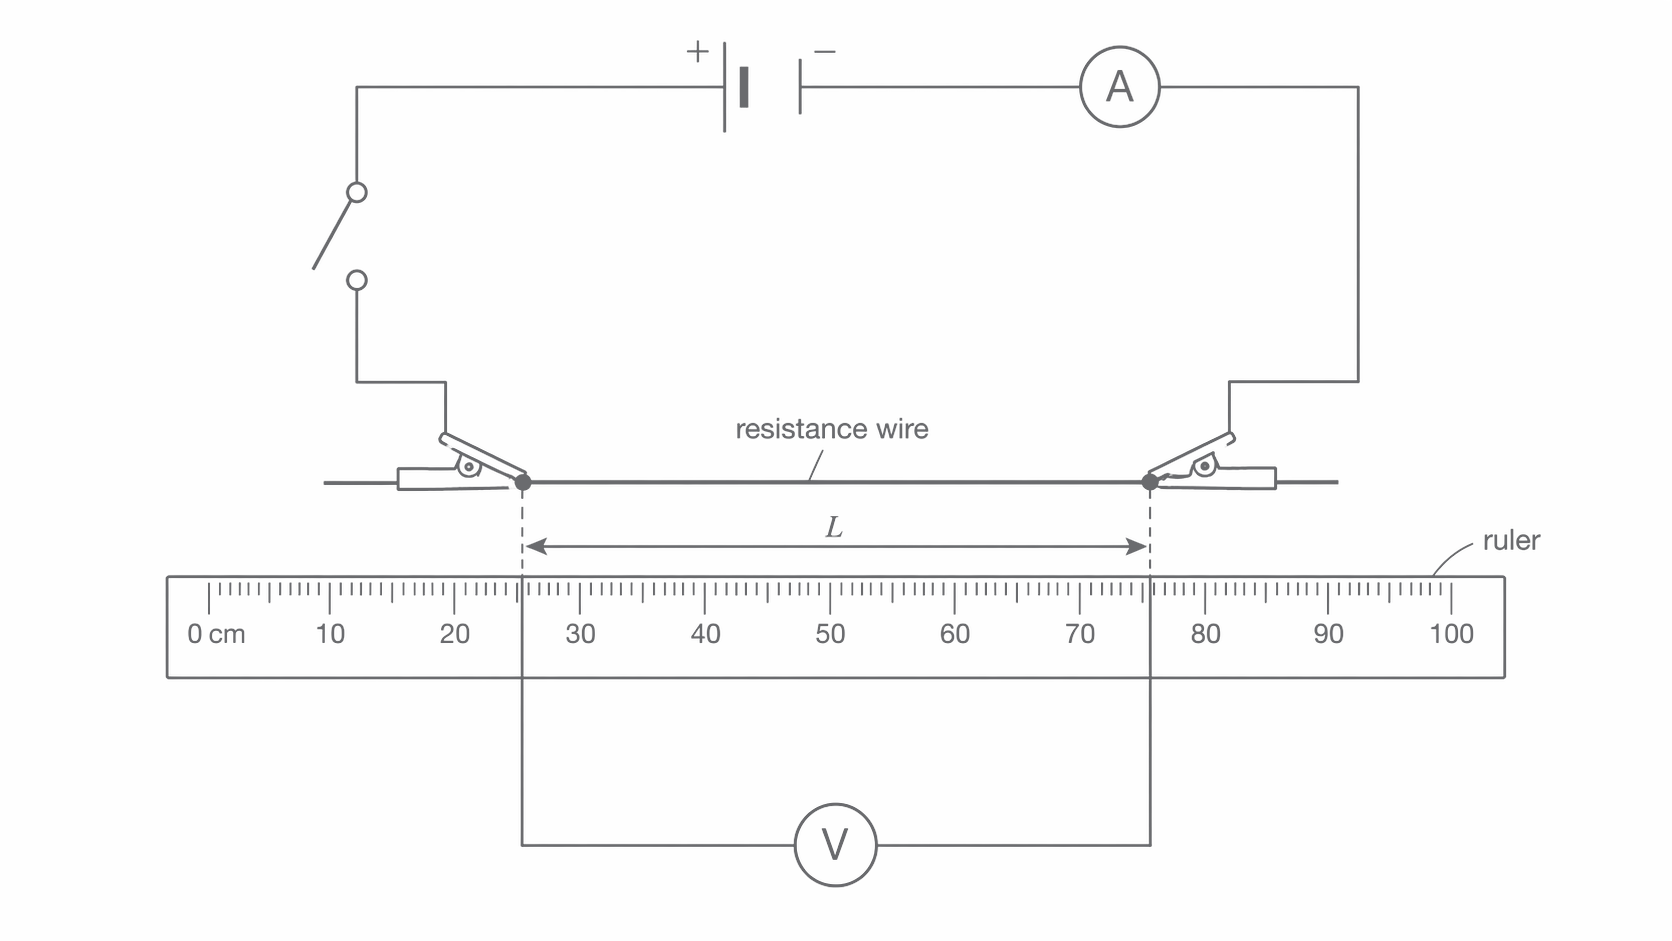
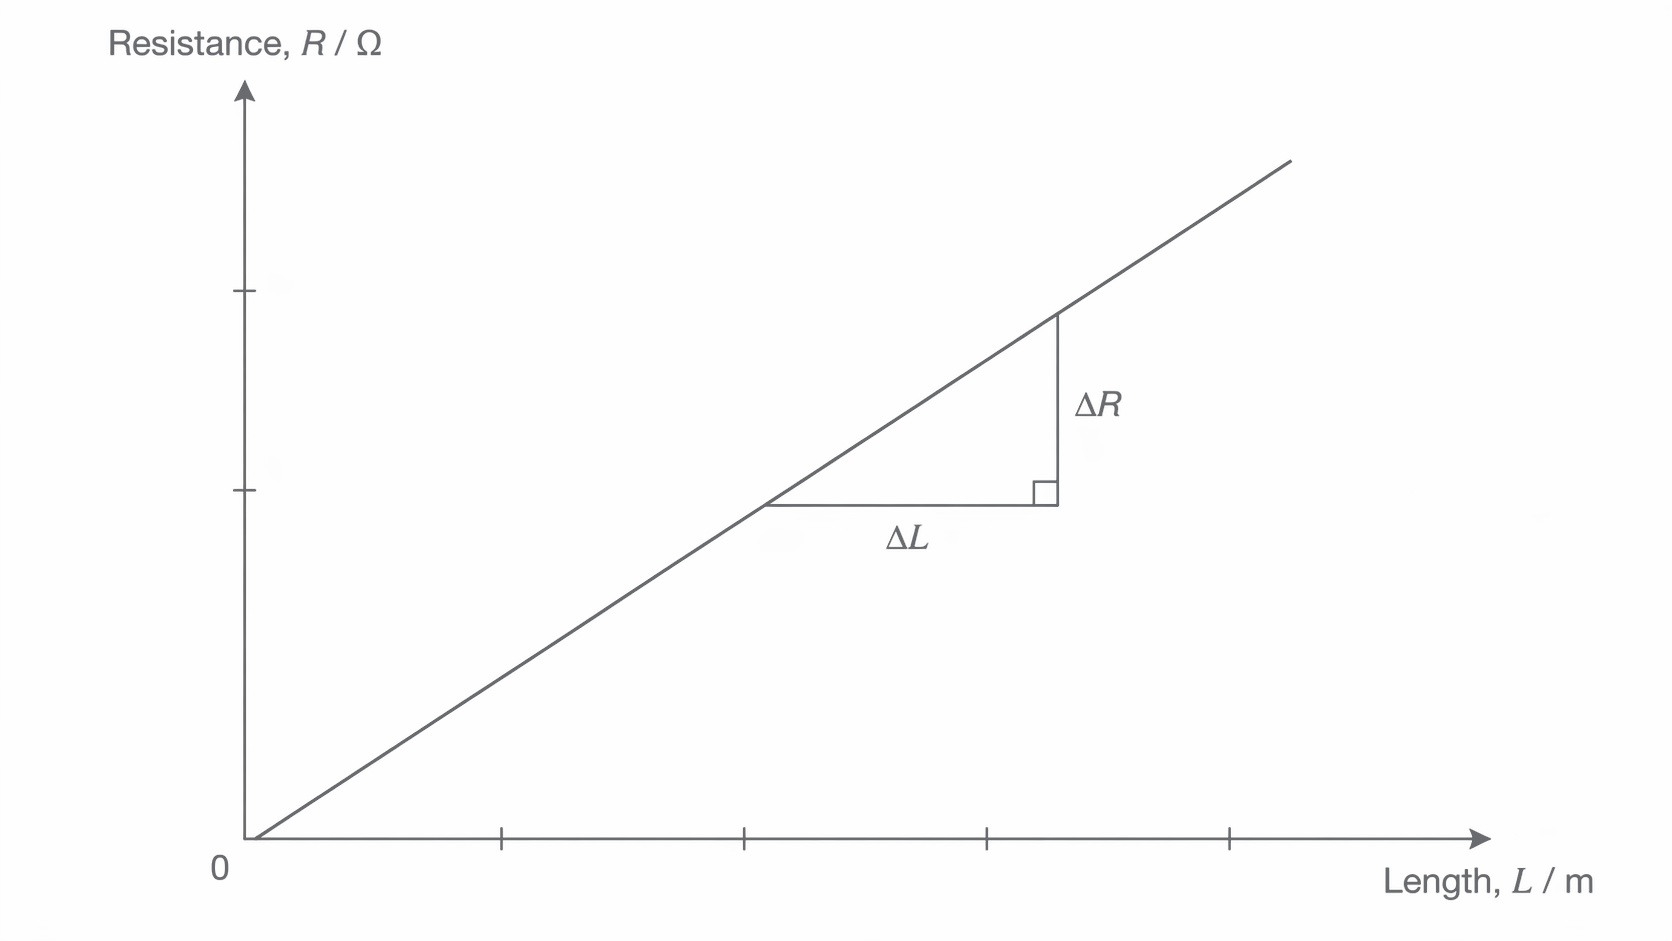
Plot a graph of (on the -axis) against (on the -axis). Since , this graph should be a straight line through the origin with gradient equal to .
Therefore:
This graphical method is more reliable than a single measurement because plotting multiple points allows you to identify and discard anomalous results, and the gradient uses all the data. In the graph below, notice the straight line through the origin and the gradient triangle showing exactly how is taken.
[DIAGRAM: asset_name: 5.1.3 - Resistivity - Diagram 2; asset_slug: 5.1.3 - Resistivity - Diagram 2; recommended_method: retained_png; description: Graph with R / on the y-axis and L / m on the x-axis, showing a straight line through the origin. A triangle drawn on the line illustrates the gradient calculation .]
High-voltage power lines that span hundreds of kilometres must be designed with resistivity in mind. Aluminium (resistivity ) is preferred over copper despite having higher resistivity, because its much lower density means the cables are lighter and cheaper to support, reducing the load on pylons. Engineers use the resistivity equation to calculate the required cross-sectional area that keeps energy losses within acceptable limits over these vast lengths.
When a wire is stretched, both its length and cross-sectional area change. If a wire is stretched to twice its original length while its volume remains constant, the cross-sectional area halves (since volume is constant). The new resistance is:
So doubling the length quadruples the resistance — the factor of 4 arises because both doubles and halves.
Effect of Temperature on Resistance
Resistivity is not a fixed constant — it depends on temperature. The effect of temperature differs fundamentally between metals and thermistors.
Metal conductors
When the temperature of a metallic conductor increases, its resistance increases. The mechanism is as follows:
- The positive metal ions possess more thermal energy at higher temperatures and vibrate with greater amplitude about their fixed lattice positions.
- The conduction electrons (charge carriers) undergo more frequent collisions with these vibrating ions as they drift through the metal.
- This increased scattering impedes the flow of charge, reducing the drift velocity for a given electric field.
- Since current decreases for a given pd, the resistance increases.
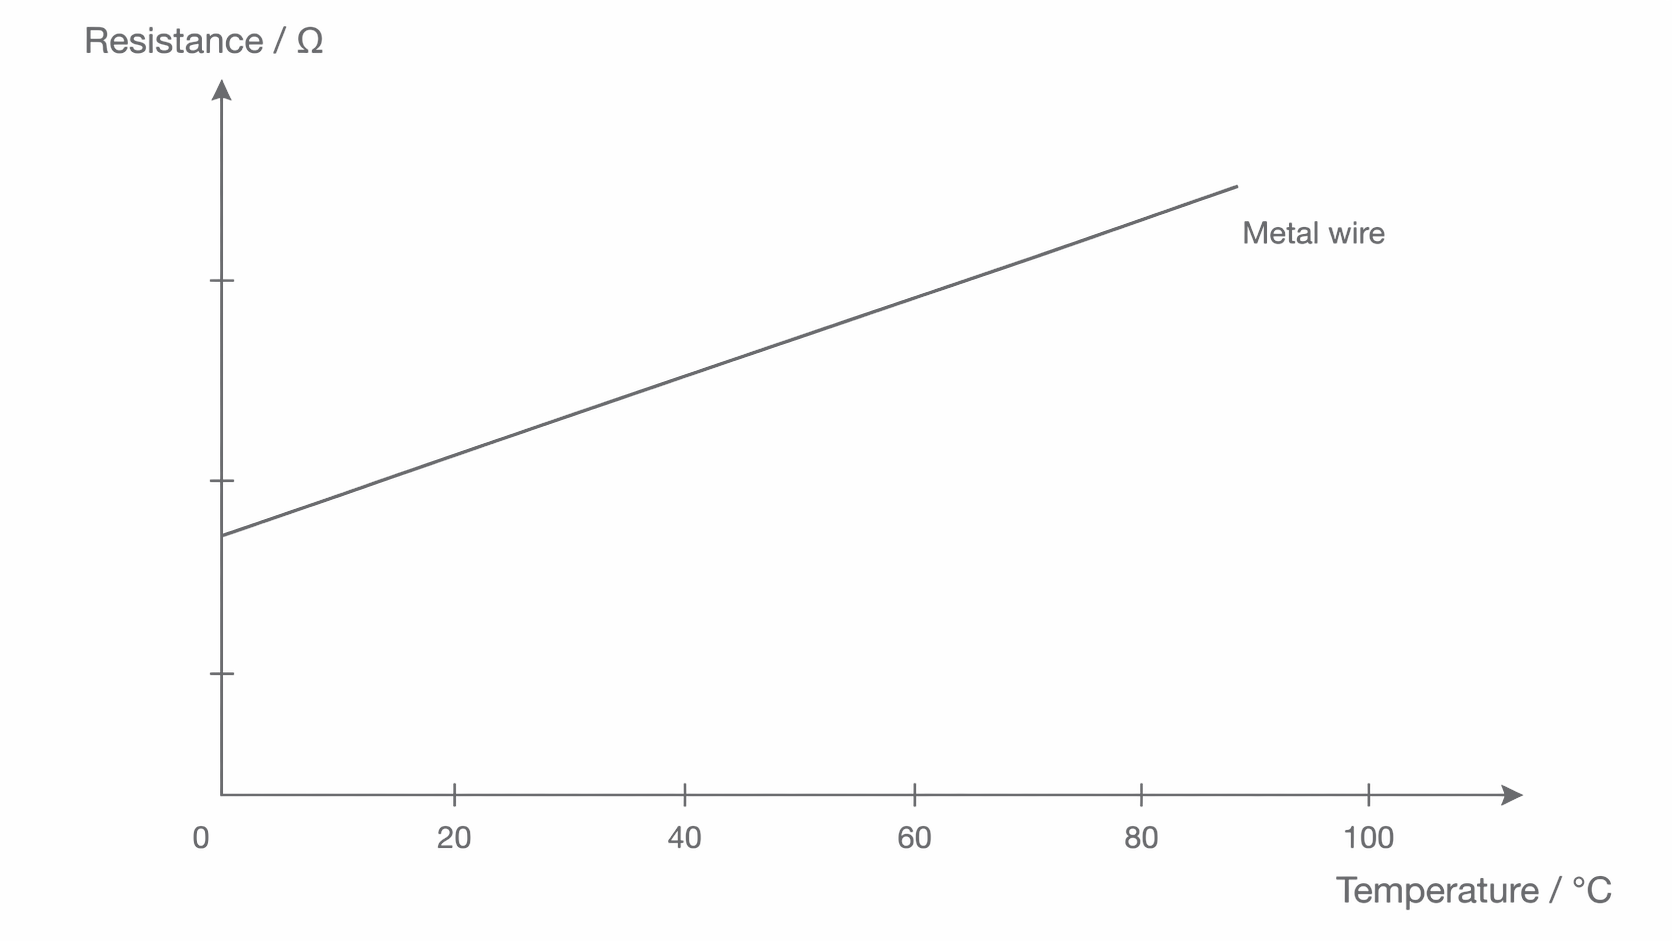
A metal is said to have a positive temperature coefficient of resistance. The graph below shows this trend, so notice the approximately straight rise in resistance with temperature over a moderate range.
[DIAGRAM: asset_name: 5.1.3 - Resistivity - Diagram 3; asset_slug: 5.1.3 - Resistivity - Diagram 3; recommended_method: retained_png; description: Graph with Resistance / on the y-axis and Temperature / °C on the x-axis. A straight line with a positive gradient rises from a non-zero y-intercept, labelled "Metal wire". The line is approximately linear over a moderate temperature range.]
Thermistors (NTC)
NTC Thermistor
A negative temperature coefficient (NTC) thermistor is a component whose resistance decreases as its temperature increases.
The specification states that only NTC thermistors will be considered. The mechanism for a thermistor is fundamentally different from that of a metal:
- In a semiconductor material, increasing the temperature provides thermal energy that releases more electrons from atoms, creating additional charge carriers.
- The increase in the number of charge carriers far outweighs the increased lattice vibrations.
- The greater number of charge carriers means more current flows for a given pd, so resistance decreases.
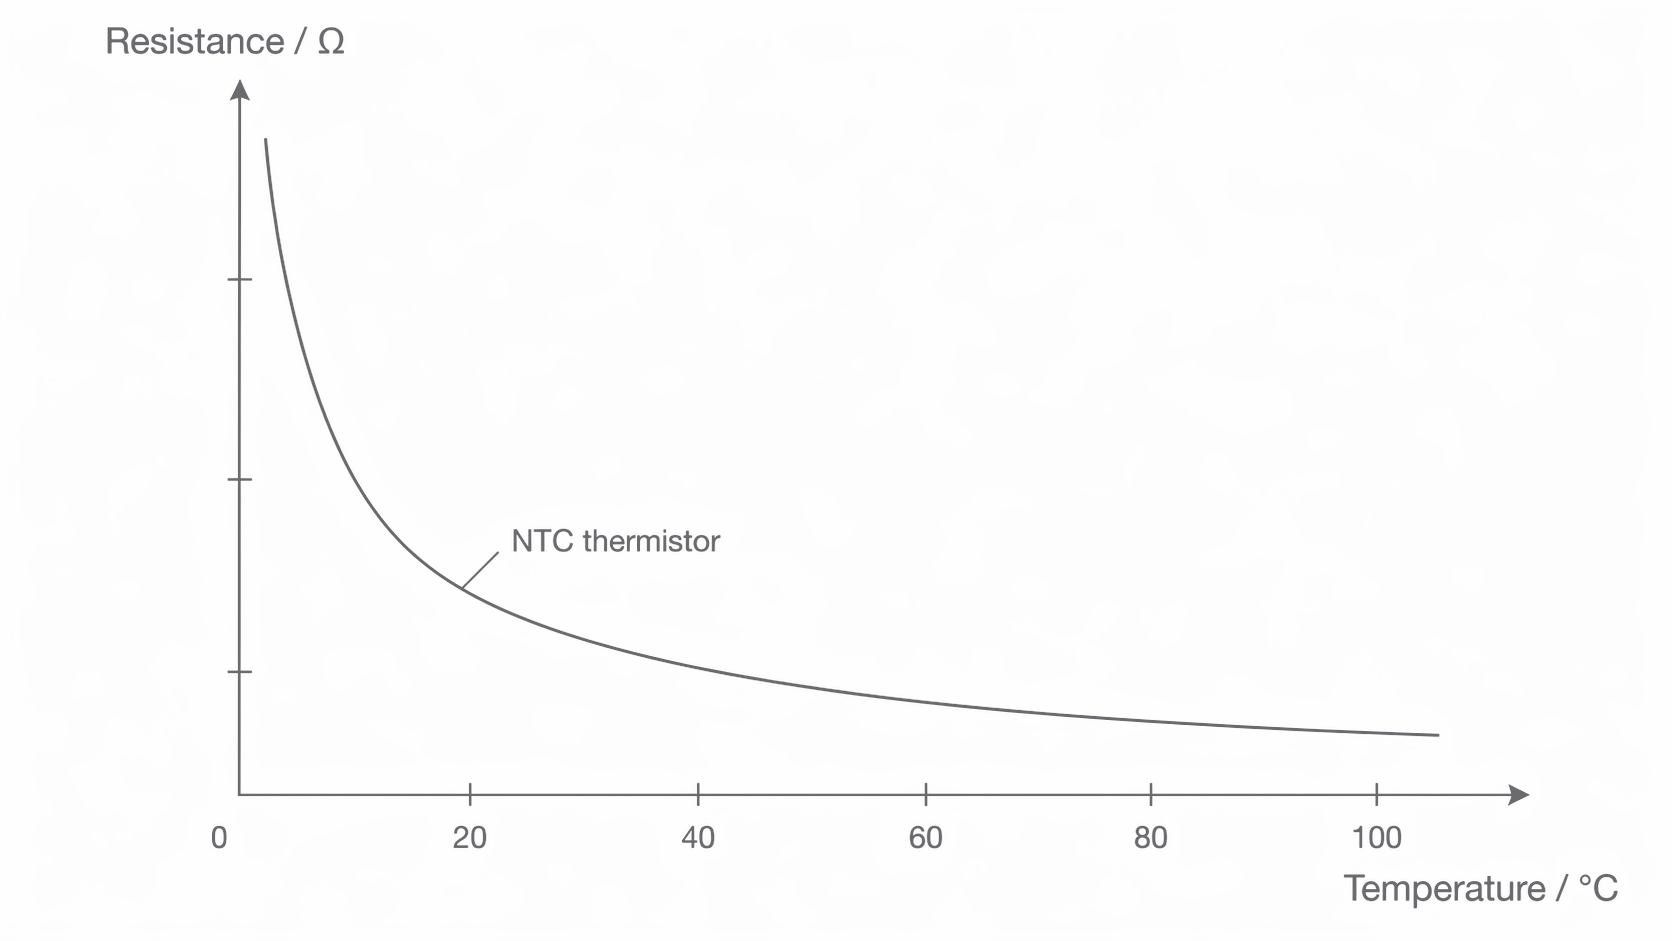
The resistance of a thermistor does not decrease linearly — it falls steeply at low temperatures and more gradually at higher temperatures. The graph below shows that changing gradient clearly, so notice the sharp early drop and the gentler decrease at higher temperatures.
[DIAGRAM: asset_name: 5.1.3 - Resistivity - Diagram 4; asset_slug: 5.1.3 - Resistivity - Diagram 4; recommended_method: retained_png; description: Graph with Resistance / on the y-axis and Temperature / °C on the x-axis. A curve starts high on the y-axis at low temperature and decreases steeply at first then more gradually, forming a characteristic exponential decay shape. Labelled "NTC Thermistor".]
Applications of thermistors
Because the resistance of an NTC thermistor changes predictably with temperature, thermistors are widely used as temperature sensors. In a potential divider circuit, the changing resistance of the thermistor causes the output voltage to vary with temperature. This can be used to trigger events — for example, switching on a heating system when the room temperature drops below a set value, or activating a warning alarm if an engine overheats.
The resistance-temperature graph of a thermistor is a key feature that the specification requires you to know. Unlike a metal, the relationship is non-linear: the resistance drops rapidly at first, then levels off.
Digital thermometers used in medicine and weather stations typically contain NTC thermistors as their sensing element. A microprocessor reads the resistance of the thermistor and converts it to a temperature reading using a calibration curve stored in memory. Because the resistance changes significantly even for small temperature changes, NTC thermistors provide good sensitivity, making them ideal for applications requiring precise temperature monitoring.
Superconductivity
Some materials exhibit a remarkable property when cooled to very low temperatures: their resistivity drops abruptly to exactly zero.
Superconductor
A superconductor is a material that has zero resistivity at and below a critical temperature that depends on the material.
Critical Temperature
The critical temperature (also called the transition temperature) is the temperature at or below which a material becomes superconducting, exhibiting zero resistivity.
The critical temperature varies between materials. Most known superconductors have critical temperatures close to (). However, some compounds — known as high-temperature superconductors — have critical temperatures above (, the boiling point of liquid nitrogen), which makes cooling them more practical. As of recent research, the highest claimed critical temperatures are around () for compounds containing mercury, barium, calcium, copper, and oxygen.
Note: the specification states that critical field will not be assessed. The graph below shows the defining feature of superconductivity, so notice the abrupt drop to zero resistivity at the critical temperature and the flat zero-resistivity line below it.
[DIAGRAM: asset_name: 5.1.3 - Resistivity - Diagram 5; asset_slug: 5.1.3 - Resistivity - Diagram 5; recommended_method: retained_png; description: Graph with Resistivity on the y-axis and Temperature / K on the x-axis. The curve shows constant resistivity above a certain temperature, then drops sharply to zero at the critical temperature (marked with a dashed vertical line). Below , the resistivity remains at exactly zero. The critical temperature is clearly labelled.]
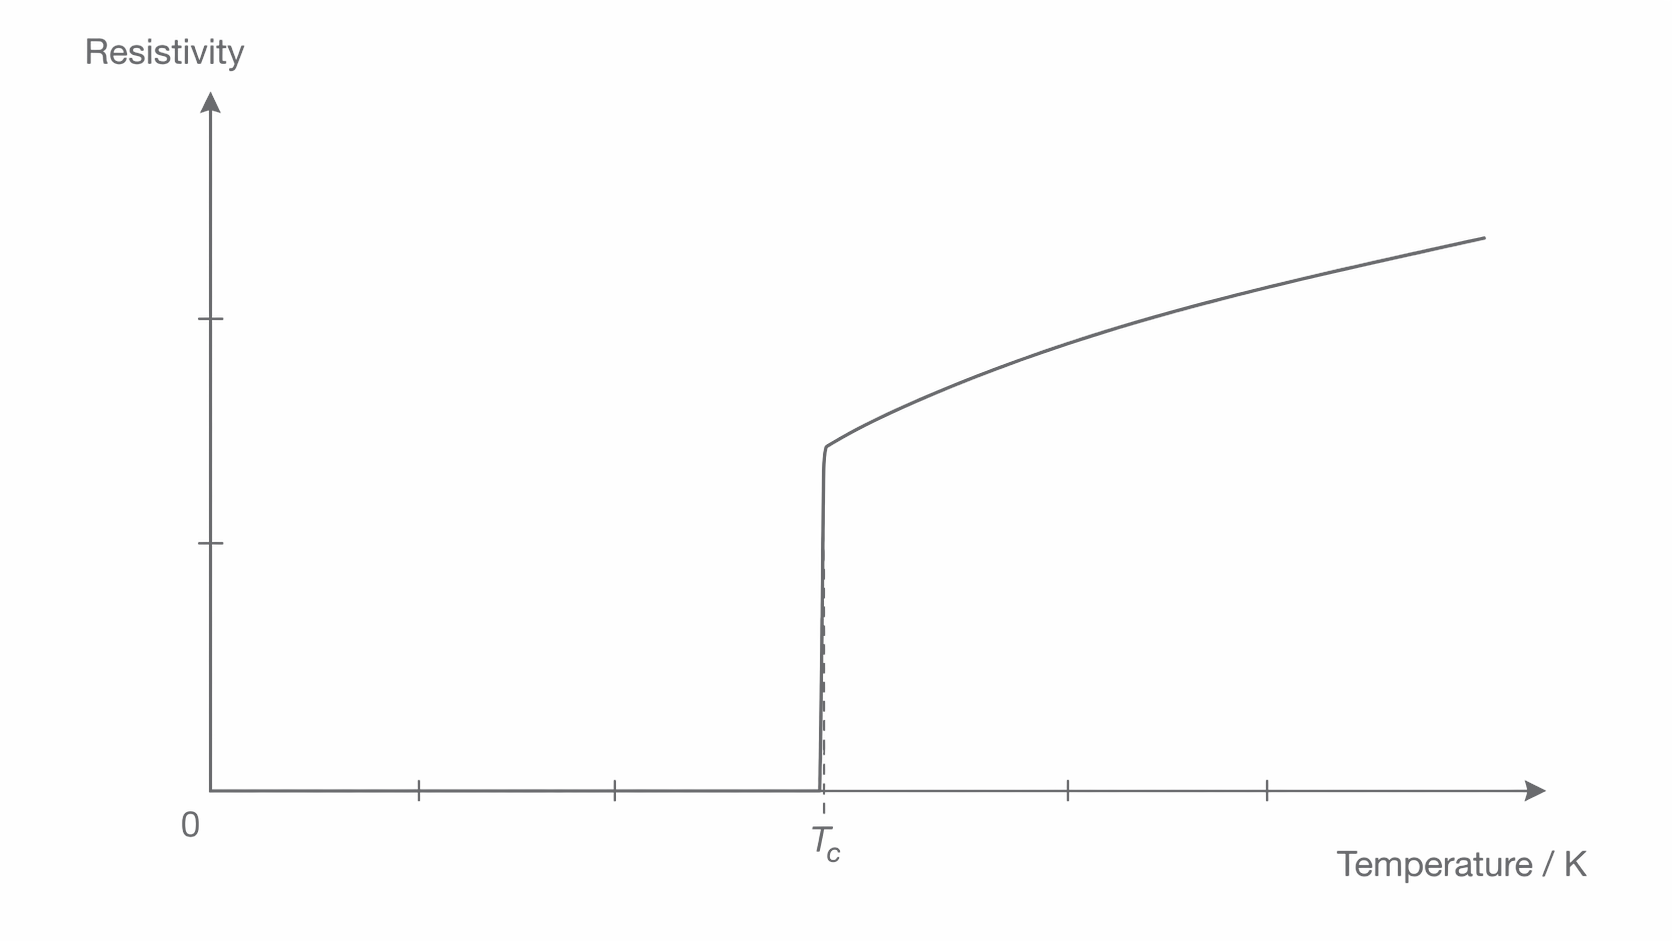
Since resistivity is zero, resistance is also zero (from ). When a current passes through a superconductor, there is no pd across it (since ) and therefore no heating effect — no energy is dissipated.
A superconductor has zero resistivity (and therefore zero resistance) at and below its critical temperature. This means current flows without any energy loss.
Applications of superconductors
The specification identifies two key applications:
-
Production of strong magnetic fields: Superconducting coils can carry very large currents without any resistive heating, allowing them to generate extremely strong and sustained magnetic fields. These are used in MRI (magnetic resonance imaging) scanners in hospitals and in particle accelerators such as the Large Hadron Collider at CERN.
-
Reduction of energy loss in transmission of electric power: Conventional power cables dissipate energy as heat due to their resistance. Superconducting power cables would have zero resistance, eliminating these transmission losses entirely. This could significantly improve the efficiency of electrical power grids, though the practical challenge remains that the cables must be kept below their critical temperature.
The main barrier to widespread use of superconductors is the need for extremely low temperatures. Cooling to near absolute zero is expensive and energy-intensive, which currently limits practical applications to situations where the benefits clearly justify the cooling costs — such as in medical imaging and fundamental research.