3.2.2.3 - Energy Levels and Photon Emission
When light from atomic hydrogen is viewed through a diffraction grating, it does not spread into every possible colour. Instead, a few sharp lines appear at specific wavelengths. That observation is strong evidence that atoms can only gain or lose particular amounts of energy. In this lesson, you will link those lines to electron transitions, use hf = E_1 - E_2, and handle energy values in both J and eV.
Part 1: Discrete energy levels
Electrons in an atom cannot have any value of energy they like. They can only occupy certain allowed states. The lowest allowed state is the ground state. If energy is supplied to the atom, an electron can move to a higher allowed state and the atom is then in an excited state.
Discrete energy levels
Discrete energy levels are fixed, allowed energies that electrons in an atom can have. Electrons cannot exist at energies between these levels.
We often show these allowed states on an energy level diagram using horizontal lines. A transition between two lines represents a change in the energy of the atom. In exam questions, the energy values may be given in electronvolts or joules, so it is important to be comfortable moving between the two units.
Electronvolt Conversion
An electronvolt, eV, is a convenient unit for atomic energies because the energy changes inside atoms are very small in joules. If you subtract two energy levels written in eV, the energy difference is also in eV. If you then want to use Planck's constant in SI units, convert that energy difference into joules first.
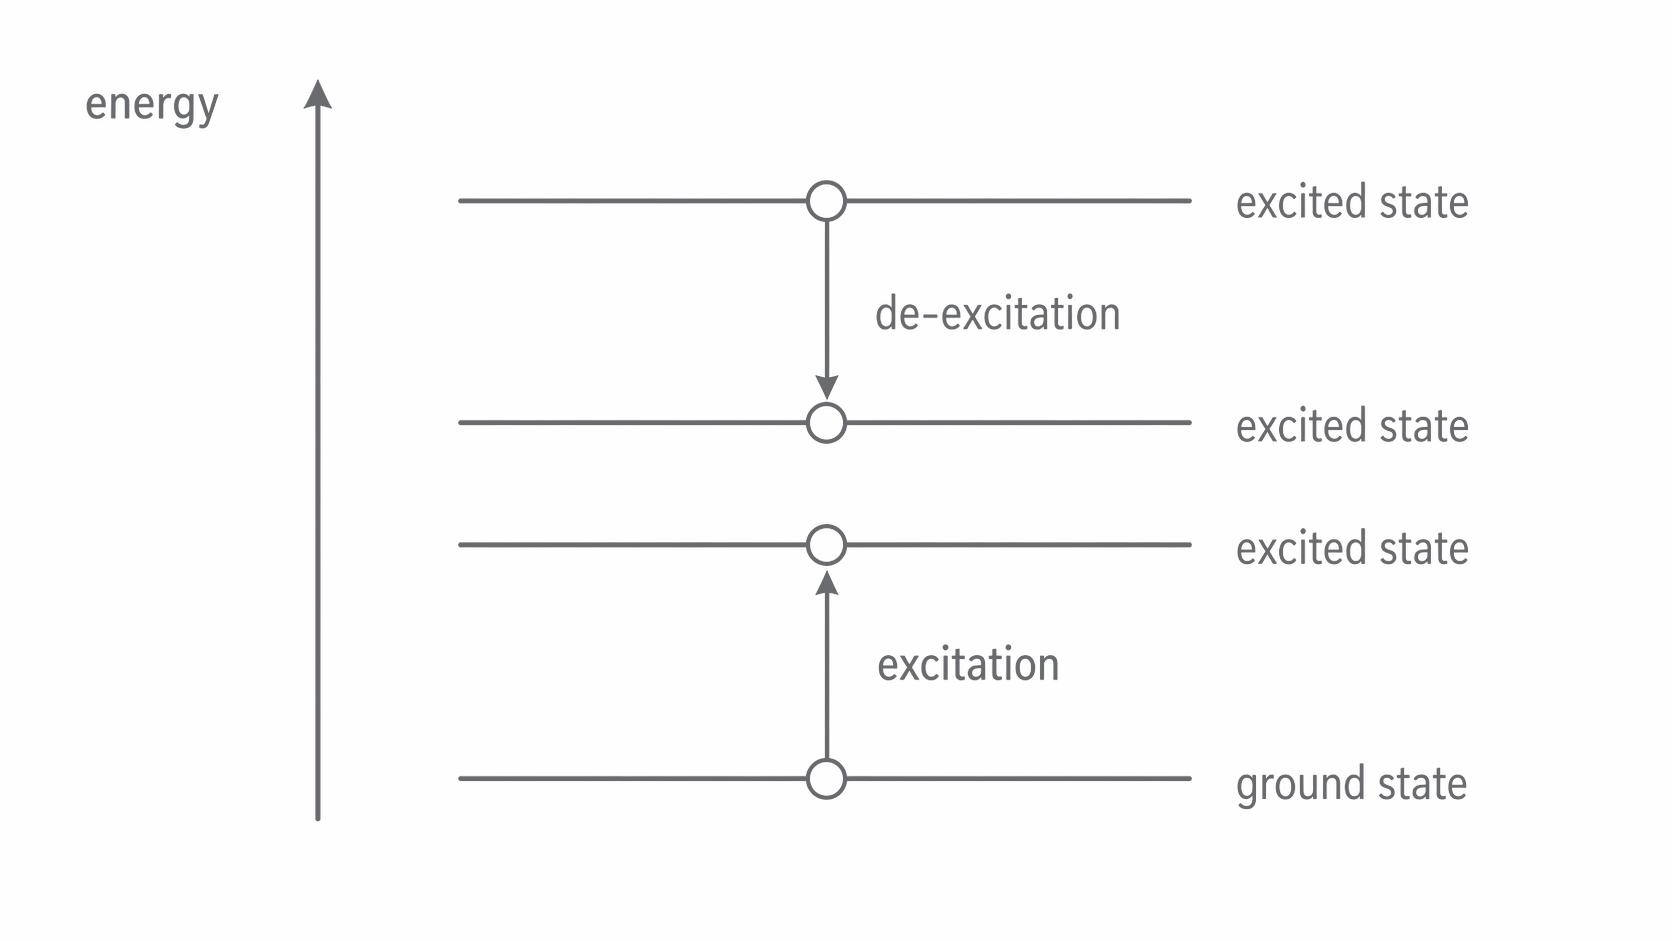
The diagram below introduces the picture to notice for this topic: electrons can sit only on the discrete horizontal lines, and they move between those lines by excitation or de-excitation.
[DIAGRAM: asset_name: 2.2.3 - Energy Levels and Photon Emission - Diagram 1; asset_slug: 2.2.3 - Energy Levels and Photon Emission - Diagram 1; recommended_method: retained_png; description: Energy level diagram with an energy axis, a ground state at the bottom, and several discrete excited states above it as separate horizontal lines. Show one upward arrow labelled excitation and one downward arrow labelled de-excitation to make clear that electrons move only between allowed levels.]
Part 2: Photon emission from transitions
An excited atom is unstable. When an electron moves from a higher energy level to a lower one, the atom loses energy. That lost energy is emitted as a photon. The photon energy is exactly equal to the difference between the two levels involved in the transition.
Photon Emission in a Transition
Here, E_1 is the higher energy level, E_2 is the lower energy level, h is Planck's constant, and f is the frequency of the emitted photon. The key idea is that the photon energy is not arbitrary. It is fixed by the energy gap. A large gap gives a high-frequency photon, while a smaller gap gives a lower-frequency photon.
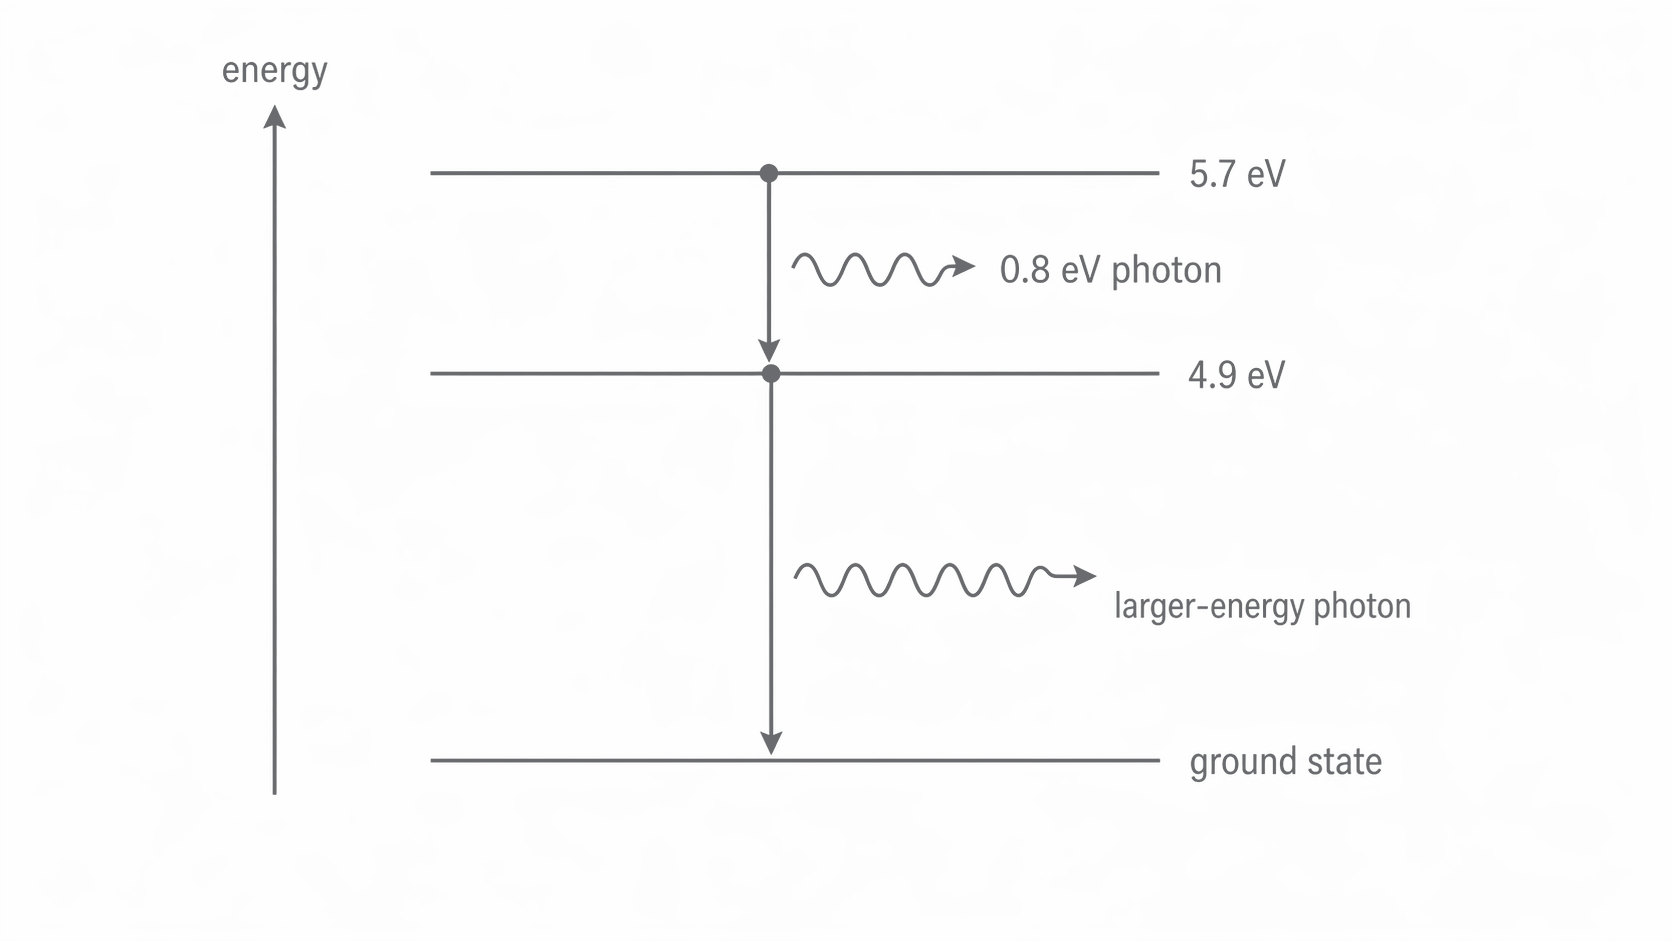
Suppose an atom drops from 5.7 eV to 4.9 eV. The energy difference is 0.8 eV, so the emitted photon has energy 0.8 eV. In joules, that is 0.8 × 1.60 × 10^-19 = 1.28 × 10^-19 J. If an atom has several allowed levels, different downward transitions can produce different photon energies, but each photon still matches one exact energy gap.
The figure below makes the comparison to notice explicit: a smaller drop between levels gives a smaller-energy photon, while a larger drop to the ground state gives a larger-energy photon.
[DIAGRAM: asset_name: 2.2.3 - Energy Levels and Photon Emission - Diagram 2; asset_slug: 2.2.3 - Energy Levels and Photon Emission - Diagram 2; recommended_method: retained_png; description: Energy level diagram with levels at 5.7 eV, 4.9 eV, and the ground state. Show one downward transition from 5.7 eV to 4.9 eV labelled "0.8 eV photon" and a second downward transition from 4.9 eV to the ground state labelled as a larger-energy photon so the different gap sizes are clear.]
This simple calculation is a good exam check: first find the difference between the levels, then decide whether you need the answer in eV or J. The difference between the levels is what matters, not the absolute value of either level by itself.
Part 3: Line spectra as evidence
If atoms could emit any energy value, then they would emit photons with any frequency and any wavelength. A spectrum from those atoms would be continuous. That is not what we observe from low-pressure gases such as atomic hydrogen. Instead, we see a line spectrum: separate bright lines at particular wavelengths.
Line emission spectrum
A line emission spectrum is a set of discrete bright lines at specific wavelengths, produced when excited atoms emit photons as electrons move to lower energy levels.
Each spectral line corresponds to one photon energy, and each photon energy corresponds to one energy difference between two allowed levels. This gives the evidence chain that exam answers need: only certain wavelengths are emitted, so only certain photon energies are emitted, so only certain energy differences exist in the atom. Therefore the atom must have discrete energy levels.
For atomic hydrogen, the visible Balmer lines are a classic example. Hydrogen does not produce every visible wavelength. It produces only a small set of lines because its electron can only make certain allowed transitions. The same idea also explains line absorption spectra: atoms only absorb photons whose energies exactly match allowed gaps between levels.
Astronomers use spectrometers to split light from stars into spectra and compare the line pattern with spectra measured in the laboratory. The presence of hydrogen lines in starlight shows that hydrogen atoms in the star have the same allowed energy levels, and therefore the same characteristic photon energies, as hydrogen on Earth.
The diagram below shows the observational difference to notice: a continuous spectrum fills every wavelength region, whereas hydrogen gives only a few discrete lines at specific positions.
[DIAGRAM: asset_name: 2.2.3 - Energy Levels and Photon Emission - Diagram 3; asset_slug: 2.2.3 - Energy Levels and Photon Emission - Diagram 3; recommended_method: retained_png; description: Side-by-side comparison of a continuous spectrum and the line spectrum of atomic hydrogen in NovaLearn monochrome style. Put both on matching wavelength axes. Show the continuous spectrum as one unbroken shaded horizontal band, and show the hydrogen spectrum as only a few narrow vertical lines at discrete positions with labels indicating that only specific wavelengths are present.]
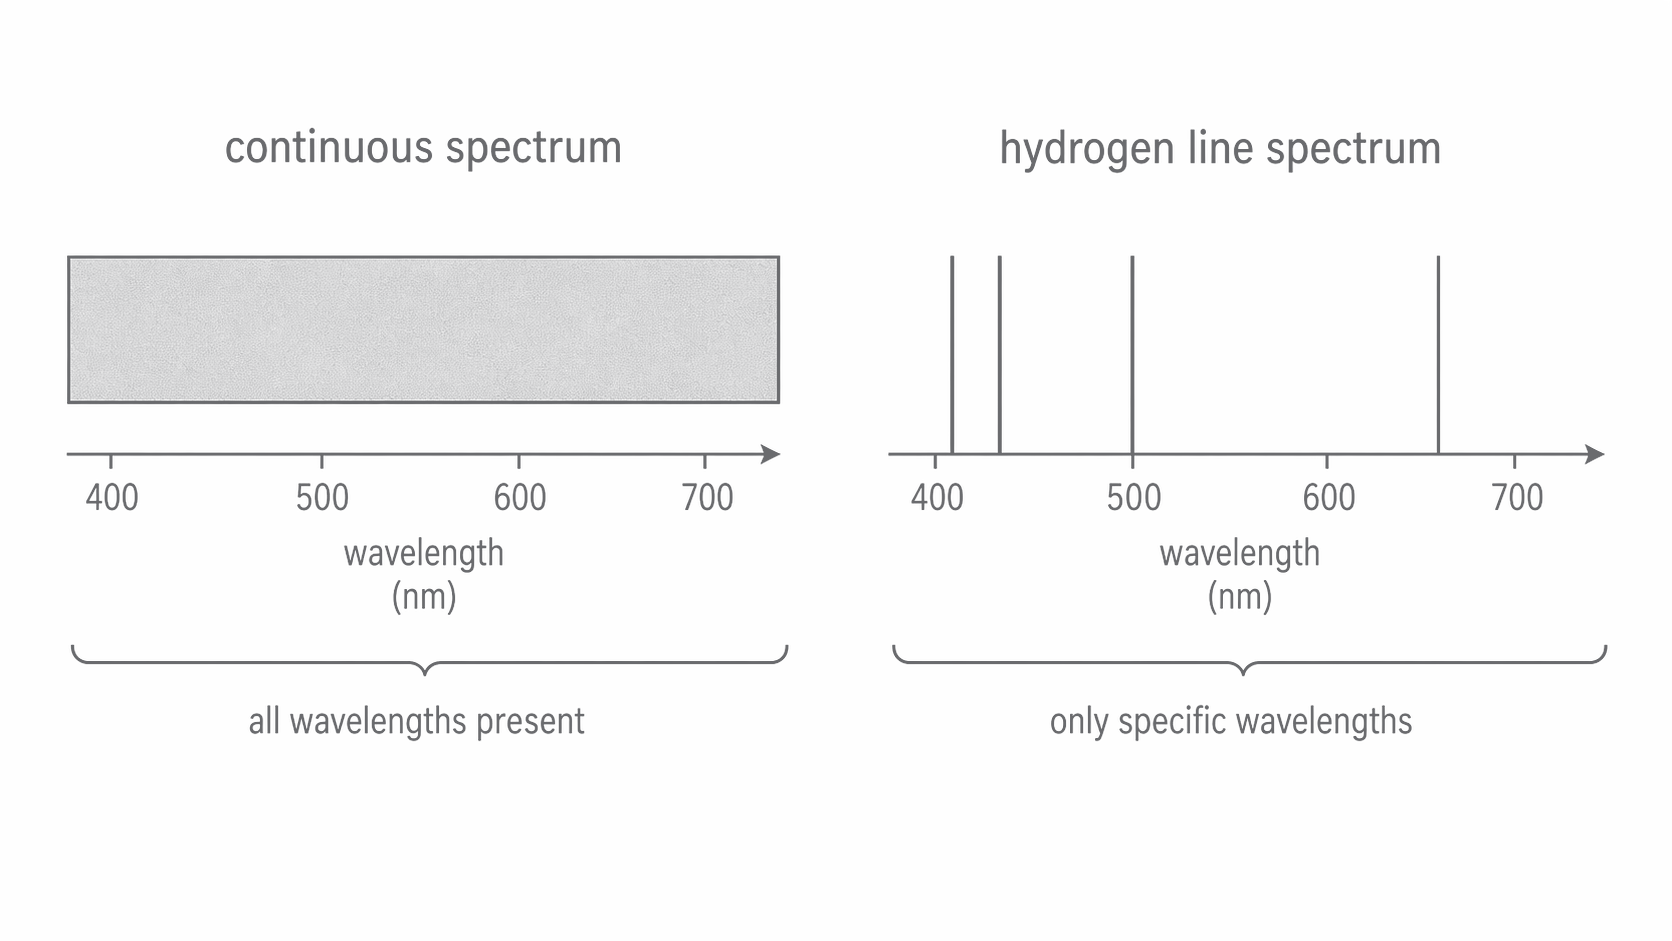
In an exam answer, that observed pattern matters more than the colours themselves. The separate lines show that hydrogen atoms are only emitting photons with certain exact energies, so the electron transitions inside the atom must also involve certain exact energy changes.
Whenever you see a line spectrum, think about the chain from wavelength to photon energy to energy-level difference. The lines are not just a pattern of colours. They are direct evidence that the atom cannot change energy by arbitrary amounts.
Part 4: Using wavelength data in questions
Sometimes the question gives you the wavelength of a spectral line instead of the two energy levels directly. In that case, you work from wavelength to photon energy, and that photon energy is the energy difference between the two levels. Remember to convert nanometres into metres before substituting into the equation.
Photon Energy from Wavelength
Here, E is the photon energy, c is the speed of light, and λ is the wavelength. For example, a hydrogen line at 486 nm corresponds to λ = 4.86 × 10^-7 m. Substituting gives E = (6.63 × 10^-34 × 3.00 × 10^8) / (4.86 × 10^-7) = 4.09 × 10^-19 J, which is 2.56 eV. That means the transition gap between the two hydrogen energy levels is 2.56 eV.
The exam habit to build is straightforward: identify the energy gap, keep units consistent, and convert only when needed. A line spectrum gives you specific wavelengths, and those wavelengths point directly to specific photon energies and therefore specific energy-level differences.