3.2.2.1 - The Photoelectric Effect
The photoelectric effect showed that light does not behave like a continuous wave in every situation. Electrons are emitted from a metal only when the light has a high enough frequency, and that simple fact led Einstein to the photon model of light. In this lesson you will focus on the observations, the threshold frequency, the work function, stopping potential, and the photoelectric equation.
Part 1: Core observations
The photoelectric effect is the emission of electrons from the surface of a metal when electromagnetic radiation of sufficiently high frequency is incident on it. The emitted electrons are called photoelectrons.
Photoelectric Effect
The photoelectric effect is the emission of electrons from the surface of a metal when electromagnetic radiation above a threshold frequency is incident on it.
Experiments showed three key facts:
- There is a minimum frequency needed for emission.
- Above that minimum frequency, the number of electrons emitted each second depends on intensity.
- Emission begins without any measurable delay once suitable radiation reaches the surface.
The minimum frequency is called the threshold frequency.
Threshold Frequency
The threshold frequency, , is the minimum frequency of incident electromagnetic radiation needed to cause photoelectric emission from a particular metal.
Below the threshold frequency, no photoelectrons are emitted however intense the radiation is. Above the threshold frequency, increasing the intensity increases the number of photons arriving each second, so more electrons can be emitted each second.
The apparatus sketch below shows the observation to notice: ultraviolet radiation can discharge the electroscope by ejecting electrons, whereas visible light below the threshold frequency leaves the leaf raised.
[DIAGRAM: asset_name: 2.2.1 - The Photoelectric Effect - Diagram 1; asset_slug: 2.2.1 - The Photoelectric Effect - Diagram 1; recommended_method: retained_png; description: A zinc plate on a gold-leaf electroscope. UV radiation falls on the plate and electrons leave the surface, causing the gold leaf to fall. A second label shows that visible light below threshold does not eject electrons.]
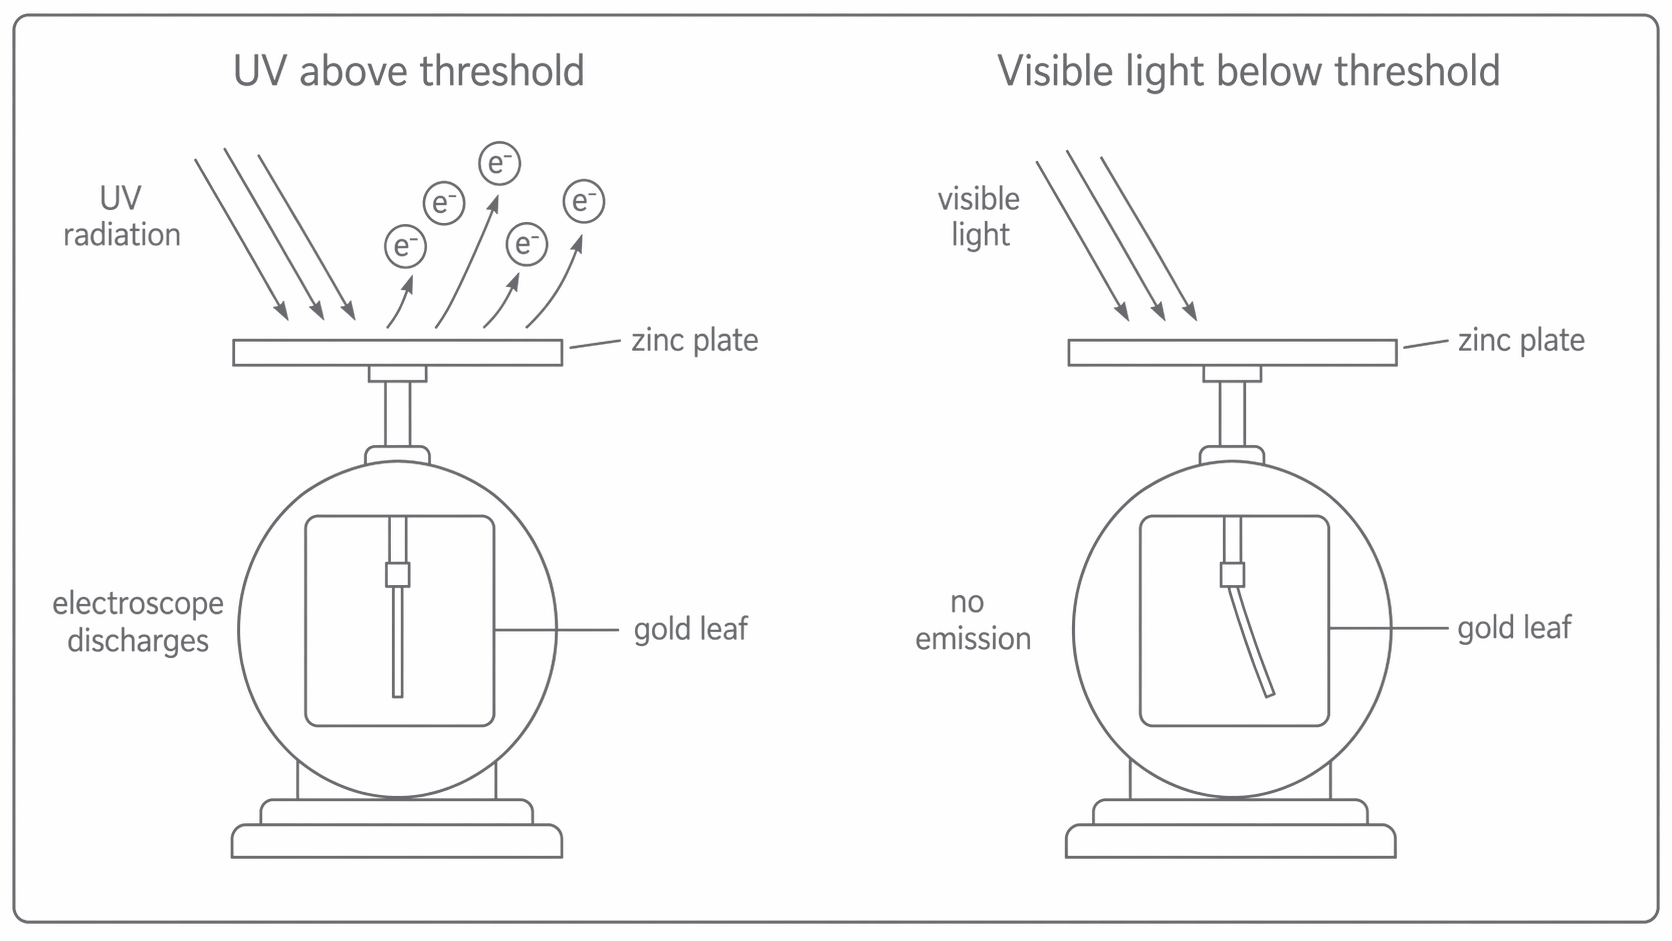
These observations were a major problem for classical wave theory, because a wave picture suggests that energy is spread continuously across the surface.
Part 2: Einstein's photon explanation
Einstein explained the observations by proposing that light arrives in discrete packets called photons, not as a continuously spread-out energy supply.
Photon Energy
Here is the Planck constant, is the frequency, is the speed of light, and is the wavelength. The crucial idea is that one surface electron absorbs one photon.
This immediately explains the threshold frequency. If a photon's energy is smaller than the minimum energy needed to free an electron, that electron cannot escape. It does not matter how many other low-energy photons arrive.
The photon model also explains the lack of a time delay. Once a photon with enough energy is absorbed, the electron can escape straight away. There is no need for the electron to "save up" energy from many weak wavefronts.
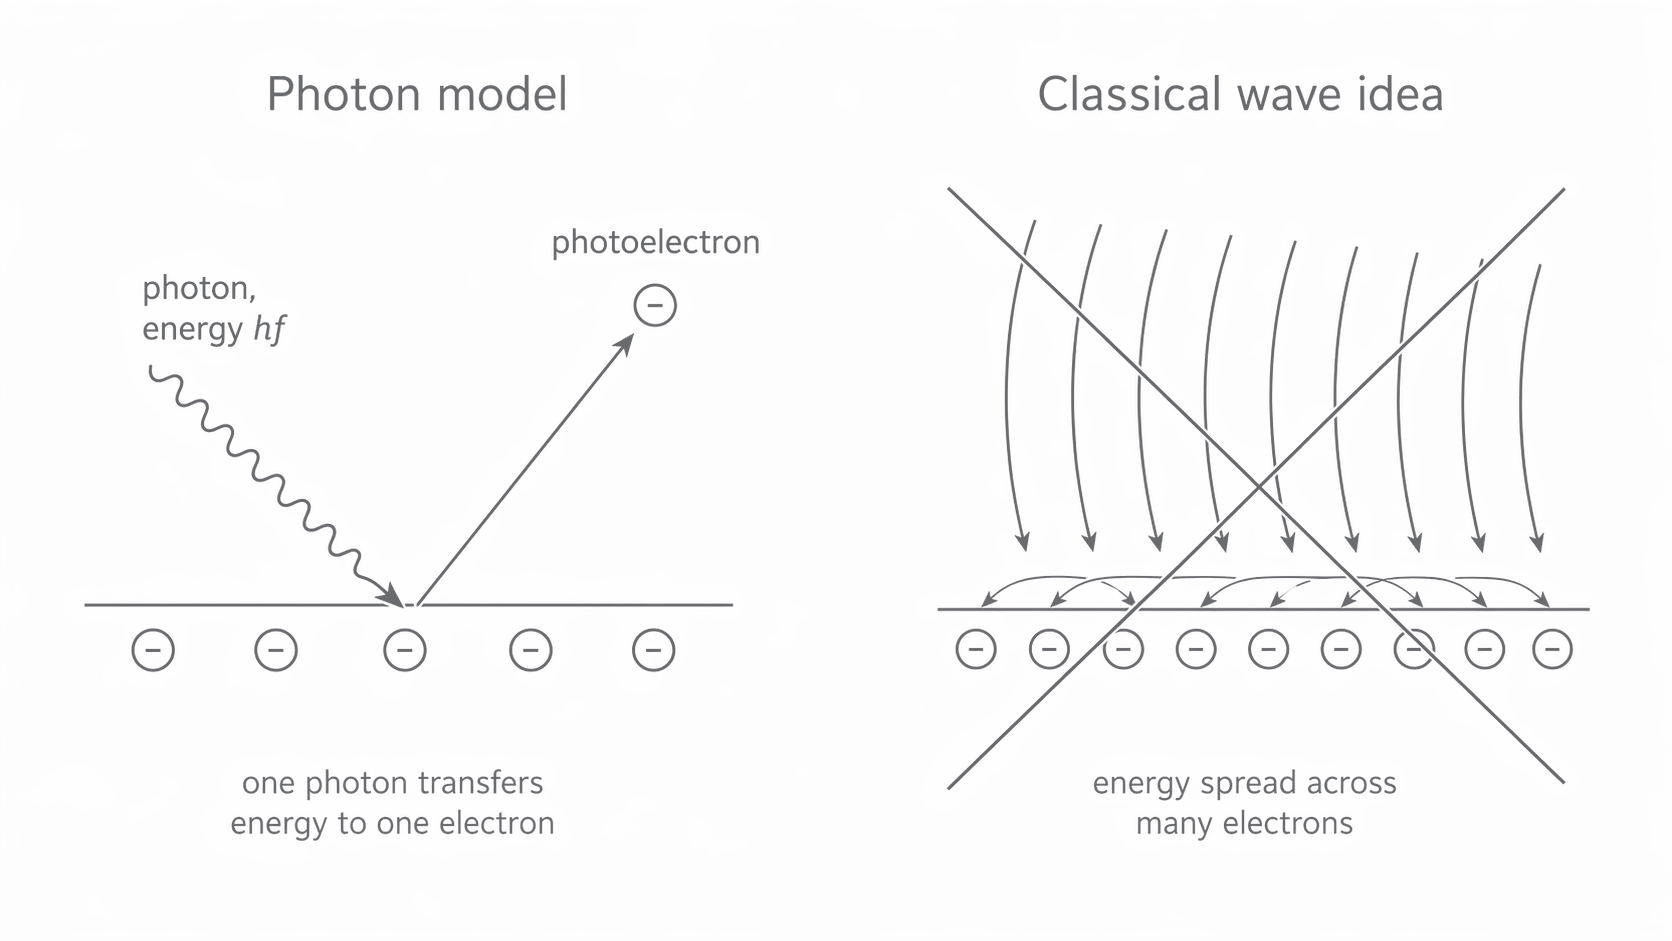
The comparison below shows what matters in Einstein's model: one photon transfers its energy to one electron, whereas a classical wave picture would smear the energy across many electrons.
[DIAGRAM: asset_name: 2.2.1 - The Photoelectric Effect - Diagram 2; asset_slug: 2.2.1 - The Photoelectric Effect - Diagram 2; recommended_method: retained_png; description: A single photon of energy striking one surface electron and ejecting it. A crossed-out comparison diagram shows a wave spreading energy over many electrons.]
Part 3: Work function and the photoelectric equation
Different metals hold their electrons with different strengths. The minimum energy needed to release an electron from a particular metal is called the work function, .
Work Function
The work function, , is the minimum energy needed for an electron to escape from the surface of a metal.
When a photon is absorbed, some of its energy is used to overcome the work function. Any remaining energy becomes the kinetic energy of the emitted electron. The most energetic photoelectrons have the maximum kinetic energy, written .
Photoelectric Equation
At the threshold frequency, the photon only just frees the electron, so and therefore
This means the threshold frequency depends on the metal because the work function depends on the metal.
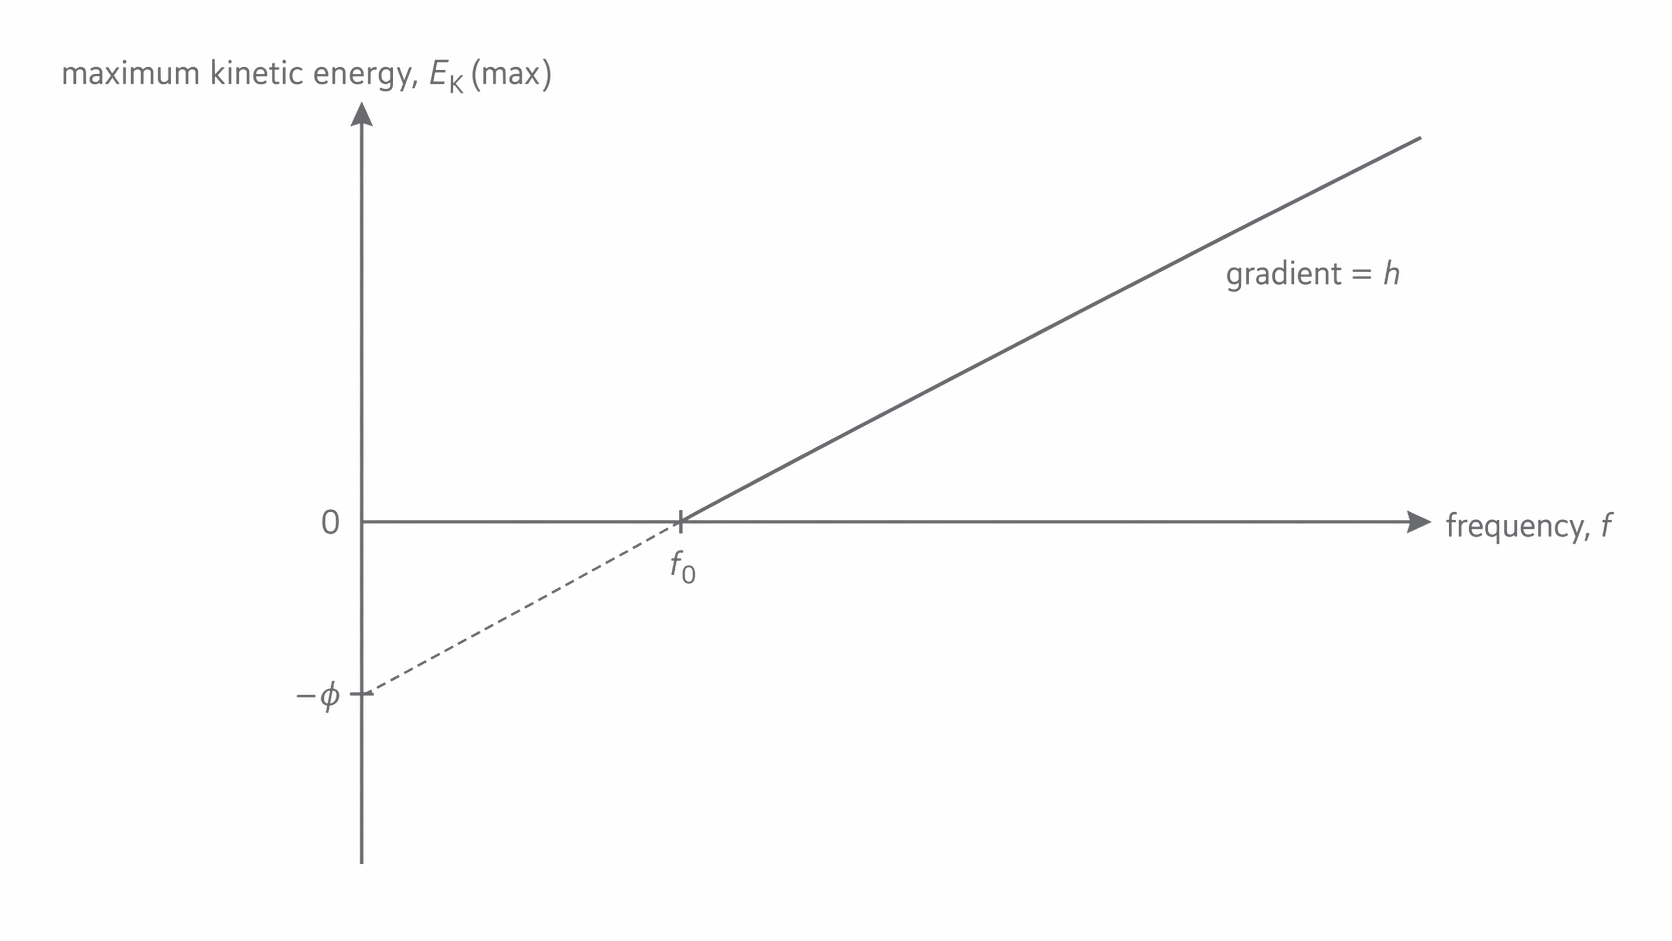
If you rearrange the photoelectric equation to
then a graph of against is a straight line with gradient , -intercept , and -intercept .
The graph below is worth learning visually, so notice the positive gradient , the x-axis crossing at , and the y-axis crossing at .
[DIAGRAM: asset_name: 2.2.1 - The Photoelectric Effect - Diagram 3; asset_slug: 2.2.1 - The Photoelectric Effect - Diagram 3; recommended_method: retained_png; description: A graph of on the y-axis against frequency on the x-axis. The line has positive gradient, crosses the x-axis at , and the y-axis at .]
Part 4: Stopping potential
The emitted photoelectrons do not all leave the surface with the same kinetic energy. The fastest ones have the maximum kinetic energy, and that is what the stopping potential measures.
Stopping Potential
The stopping potential, , is the minimum potential difference needed to stop the most energetic photoelectrons.
If a photoelectron of charge is just stopped, its maximum kinetic energy equals the electrical energy transfer .
Stopping Potential Relation
Combining this with the photoelectric equation gives
You are not required to know the experimental method for determining stopping potential, but you must know what it means and how to use it in calculations.
Vacuum photocells use a metal photocathode and an anode inside an evacuated tube. Light above the threshold frequency ejects electrons from the cathode, producing a current at the anode. The size of that current depends on how many electrons are emitted each second, while the stopping potential gives information about the maximum kinetic energy of the photoelectrons.
The calculation below uses that direct link between stopping potential and the maximum kinetic energy of the emitted electrons.
Part 5: Frequency versus intensity
Students often mix up the effect of changing frequency with the effect of changing intensity. The safest approach is to link frequency to the energy of each photon and intensity to the number of photons arriving each second.
| Change | Main effect on emission rate | Main effect on |
|---|---|---|
| Increase frequency above at the same intensity | The photons are more energetic, so the same intensity corresponds to fewer photons each second; the emission rate does not increase just because frequency increased | Increases |
| Increase intensity above at the same frequency | More photons arrive each second, so more electrons can be emitted each second | No change |
| Increase intensity below | No emission | No emission |
The important correction here is that "same intensity" does not mean "same number of photons". If the frequency rises while the intensity stays fixed, each photon carries more energy, so fewer photons are needed each second to deliver the same total power.
Explaining Threshold Behaviour
You now have the full exam toolkit for this topic: threshold frequency tells you whether emission can happen, the work function sets the energy barrier, the photoelectric equation tracks the energy balance, and the stopping potential tells you the maximum kinetic energy.