3D - Solving quadratic inequalities
The roots of a quadratic mark where its value is zero, but an inequality asks where its value has the required sign. You will find those boundaries, choose intervals using signs or a sketch, and combine the result with another condition without rounding exact endpoints.
Finding critical values
For which values of is nonpositive? At , the product is , so a value between the roots works. The roots themselves are only the boundaries of the answer.
First put every term on one side. This makes the comparison a question about whether one quadratic is positive, negative or zero.
Critical values
For a quadratic inequality written as , , or , the critical values are the real roots of .
Between successive real roots, a quadratic keeps the same sign. Its graph cannot cross the horizontal axis without passing through another root.
Use factorisation, completing the square or the quadratic formula to find the roots. You already know these methods; the new decision comes after finding them. If roots contain surds, retain their exact values.
Worked example 1: terms on both sides
Question. Find the critical values for .
Plan. Subtract the whole right side, then solve the corresponding equation.
Answer. The critical values are and . We have not yet selected the intervals that solve the inequality.
Check. The original difference is . At it is ; at it is . Both values really are boundaries where the original sides are equal.
Change only the constant on the right from to . The quadratic no longer factorises over the integers, but the boundary method is unchanged.
Worked example 2: exact irrational boundaries
Question. Find the critical values for .
Plan. Rearrange to zero and apply the quadratic formula.
Answer. The lower critical value is ; the upper is .
Check. Completing the square gives . Substituting either proposed root makes the square , so the difference is zero. This verifies the roots by a different method.
Finding critical values is an equation-solving step inside a larger inequality solution. The next part decides which of the resulting ranges to retain.
Watch out
The answer to is not “ or ”. Those are zeros, and a strict negative inequality excludes them. Use them to divide the number line before choosing the required signs.
Find boundaries only in the next question.
Choosing the correct intervals
A sign chart records whether the quadratic is positive or negative in each interval between its critical values.
For , choose one convenient value from each interval. At , both factors are negative, giving a positive product. At , the factors have opposite signs, giving a negative product. At , both factors are positive. No further roots occur within those intervals, so one test value determines the sign throughout each interval.
| Range | |||
|---|---|---|---|
| Sign of | negative | positive | positive |
| Sign of | negative | negative | positive |
| Sign of product | positive | negative | positive |
[DIAGRAM: asset_name: A quadratic crosses at two roots but only touches at a repeated root; asset_slug: quadratic-signs; caption: Distinct roots separate different signs, while a repeated root need not change the sign; description: Left graph shows y equals (x plus 2)(x minus 3), crossing the horizontal axis at minus 2 and 3 and lying below it between those roots. Right graph shows y equals minus (x minus 1) squared, touching the horizontal axis at 1 and lying below it on both sides. Blue and clay pale fills identify the negative regions.]
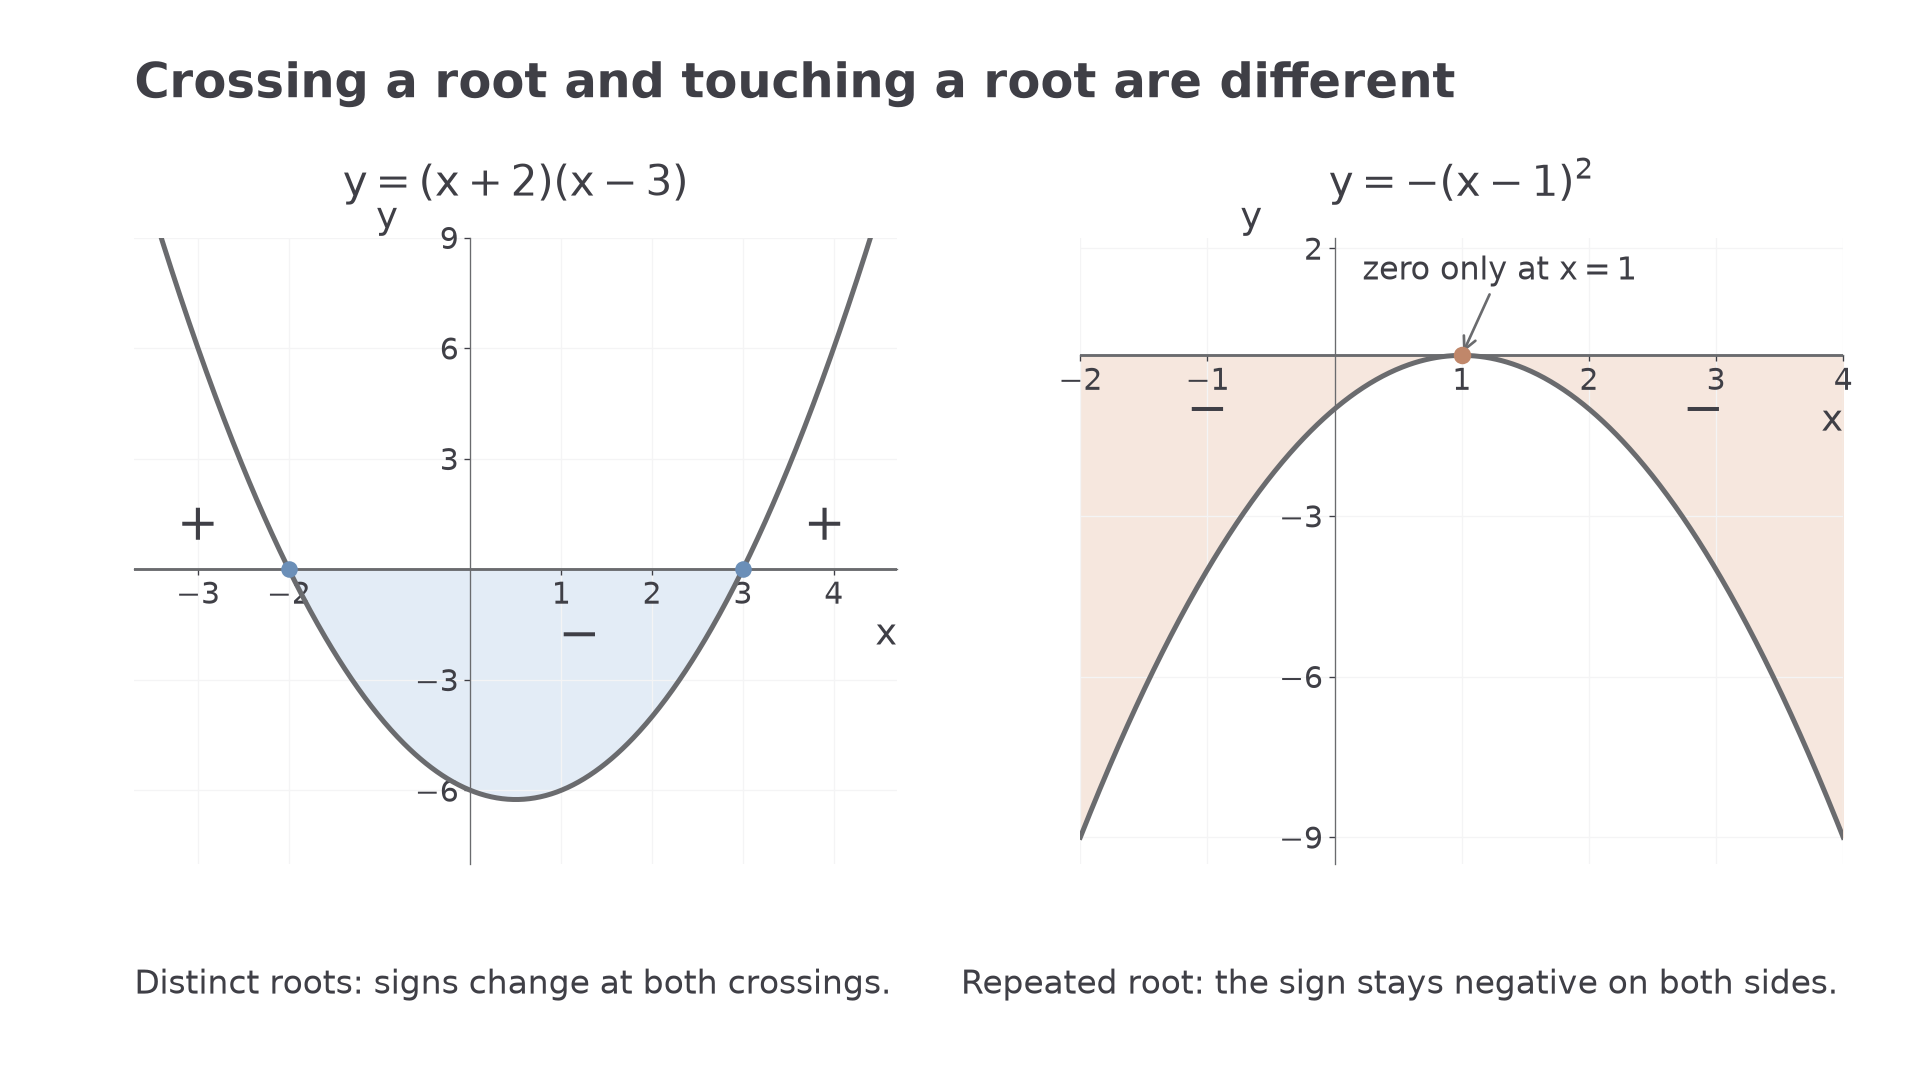
A quadratic with positive leading coefficient opens upwards; with two distinct real roots, it is negative between them and positive outside. Negating the whole expression reflects the graph in the horizontal axis and reverses all these signs.
Worked example 3: a positive leading coefficient
Question. Solve .
Plan. Use the sign chart and add the roots because equality is allowed.
Answer. , or .
Check. Expanding and completing the square gives . It is nonpositive precisely when , which gives the same endpoints. Direct tests at , and give , and .
Now change only the overall sign of the quadratic. Its roots stay fixed, but its positive and negative regions exchange places.
Worked example 4: a negative leading coefficient
Question. Solve .
Plan. Reverse the sign chart, keeping equality at both roots.
The signs of , from left to right, are negative, positive and negative.
Answer. .
Check. Multiplying the original inequality by gives , reversing the sign. The chart confirms the two outside ranges. At , the original value is , so the middle interval must be excluded.
Continue this lesson.
You’re previewing NovaLearn without an account. Create a free account to read the rest.
Create free account