1A - Exponential functions
An exponential function changes by a constant multiplier over equal input steps. You will build its values, recognise growth and decay graphs, and read the effect of multiplying or shifting an exponential expression.
Multiplicative change
A quantity multiplies by whenever its input increases by . What multiplier should it use over a half-step?
Two half-steps make one whole step. If each half-step uses multiplier , then , so . Adding half of is not the reason: multiplying twice by gives the required factor .
This is the index-law meaning of . It lets a pattern of repeated multiplication extend beyond whole-number inputs.
Exponential function
An exponential function has the input in the exponent. Its basic form is , where the constant base satisfies and .
For example, is exponential. The function is a power function: its variable is the base instead. Base gives the constant function , which we exclude from growth and decay.
Integer, negative and fractional indices give exact points. The exponential function extends this pattern smoothly to every real input; a calculator can approximate values at other inputs too.
Equal steps give equal multipliers
For , with and ,
So an input step of multiplies the output by . A unit step uses multiplier .
Not on the formulae sheet: learn it.
Build a table using the index rules, rather than guessing a straight-line pattern between entries.
Worked example 1: unit input steps
Question. Find the values of at . State the multiplier from one listed value to the next.
Plan. Evaluate the negative and zero powers first, then multiply by for each unit step.
Answer. The values are ; each successive value is multiplied by .
Check. The adjacent ratios are , and . Their differences are unequal, so this is not constant additive change.
Keep the same function, but halve the input step. The multiplier must change as well.
Worked example 2: half-unit input steps
Question. Find the values of at . State the multiplier from one listed value to the next.
Plan. Use and its reciprocal, then check the ratios.
Answer. The values are ; each successive value is multiplied by .
Check. Two half-steps multiply by , agreeing with the unit-step multiplier in Example 1.
The multiplier belongs to a specified input step. You cannot compare ratios from unequal steps as if the steps were equal.
Watch out
For , halfway between inputs and gives output , not the arithmetic midpoint . Exponential outputs multiply over equal steps; a straight line's outputs have equal differences.
Try half-steps with a different square-number base.
Exponential graph shapes
The base tells you whether the graph rises or falls, while positive outputs and the zero-index rule give features shared by both shapes.
For , each unit step doubles the output, so the graph increases. In the negative direction the values halve: . They get as close to as you wish, but remain positive.
For , each unit step halves the output, so the graph decreases. Replacing by swaps the left and right sides of the graph of : this is reflection in the -axis.
[DIAGRAM: asset_name: Growing and decaying exponentials; asset_slug: exponential-shapes; caption: Positive exponential graphs rise for a base above 1 and fall for a base between 0 and 1; both pass through (0, 1) and approach y = 0; description: Two coordinate plots on equal scales show y equals 2 to the x and y equals one half to the x. Each has the point (0, 1) marked. The increasing curve approaches the horizontal line y equals 0 towards the left; the decreasing curve approaches that line towards the right. The curves are reflections in the y-axis and remain strictly above the x-axis.]
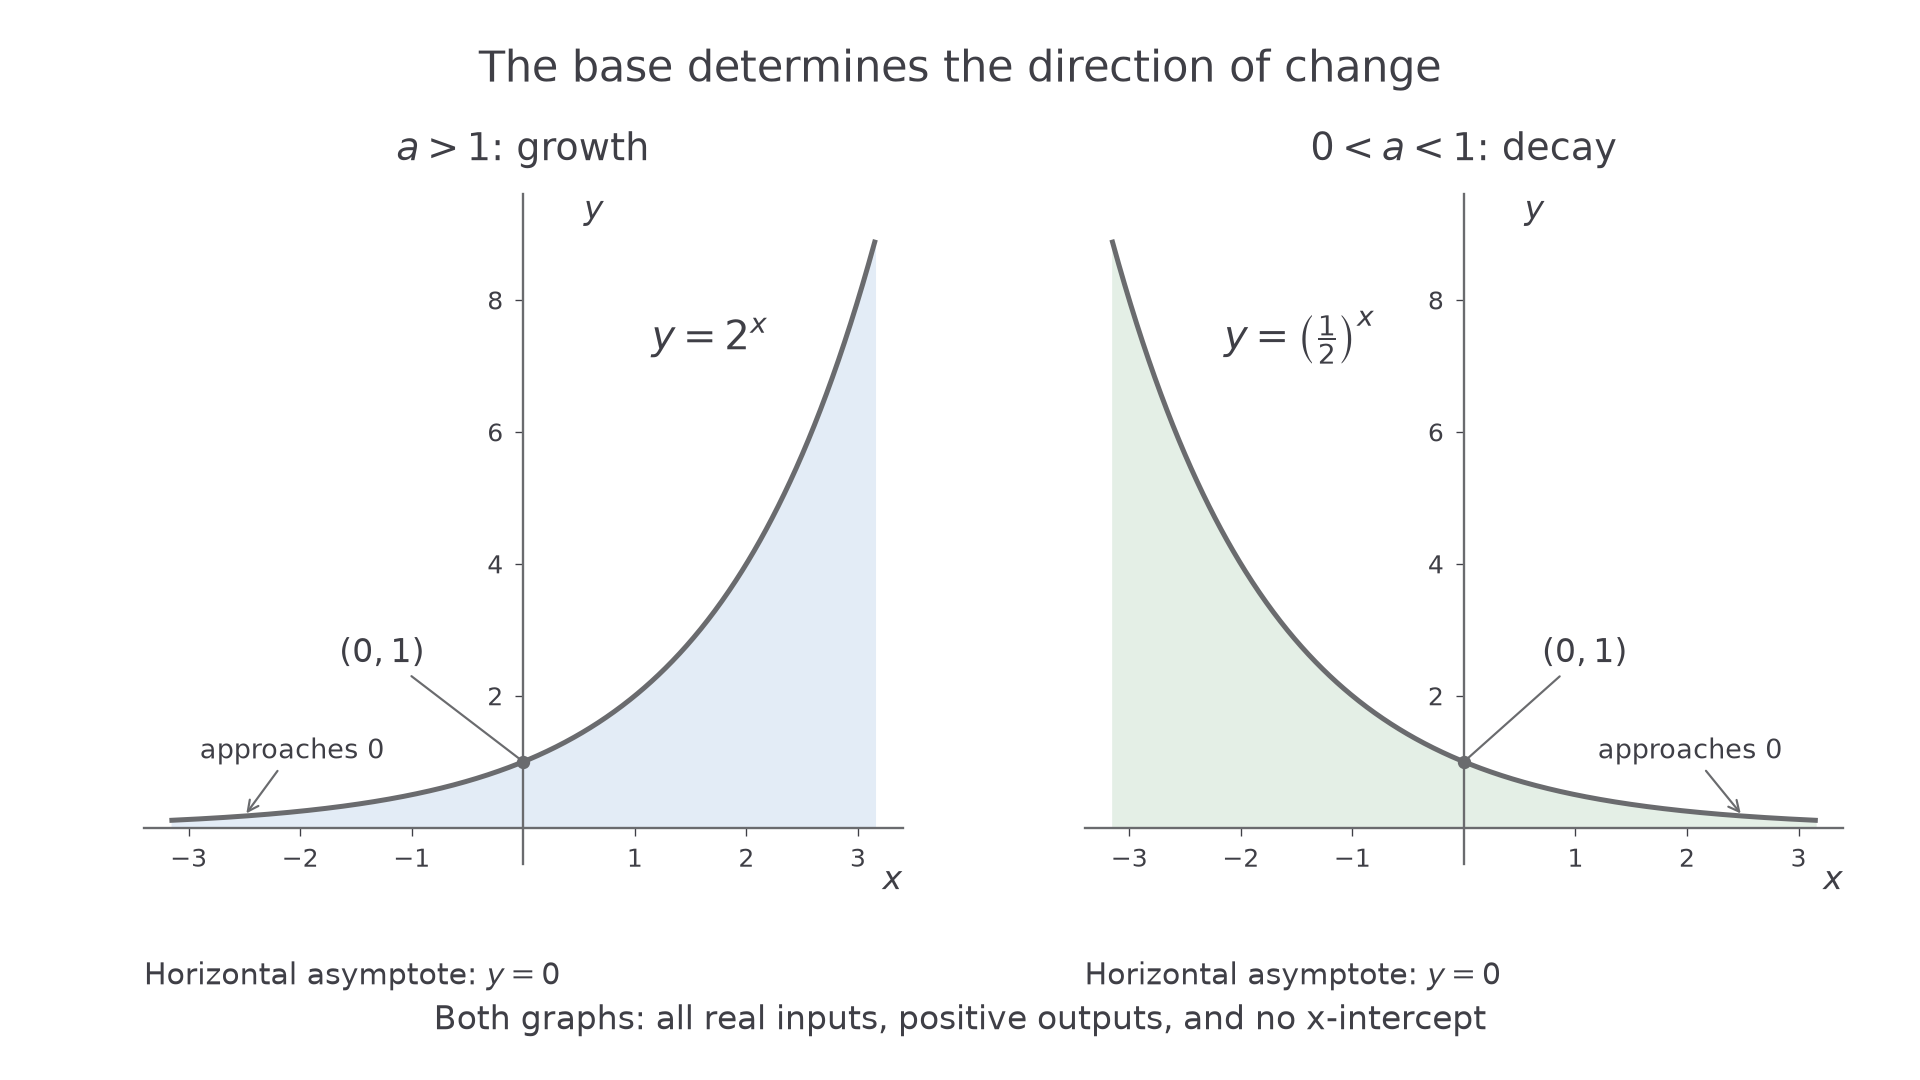
The graph is a smooth curve through its points. Joining a few calculated points with straight line segments would hide the continuous multiplicative change.
Domain, range and horizontal asymptote
The domain is the set of allowed inputs; the range is the set of resulting outputs. A horizontal asymptote is a horizontal line that the curve approaches as the input becomes very large in the positive or negative direction.
For , with and , the domain is all real , the range is , the -intercept is , and the horizontal asymptote is . This curve never meets its asymptote, so it has no -intercept.
A base greater than gives exponential growth: the output increases as increases. A base between and gives exponential decay: the output decreases as increases. Decay still has positive outputs; it does not mean the graph lies below the axis.
Worked example 3: a growth sketch
Question. Describe a sketch of , giving three exact points, its asymptote, domain and range.
Plan. Use for points, then use the multiplier and positive values to decide the shape and its end behaviour.
Draw a smooth increasing curve through , and . Towards the left it approaches from above; towards the right its values grow without bound, as in the left-hand graph.
Answer. An increasing curve with horizontal asymptote , domain all real and range .
Check. Every unit step doubles the output, including to to . No plotted point is on or below the asymptote.
Now replace the base by . The intercept and range stay the same, but the direction and the end approaching zero swap.
Worked example 4: a decay sketch
Question. Describe a sketch of , giving three exact points, its asymptote, domain and range.
Plan. Evaluate at the same inputs and use the half-size multiplier to choose the decreasing shape.
Draw a smooth decreasing curve through , and . It approaches from above towards the right, as in the right-hand graph; towards the left its values grow without bound.
Answer. A decreasing curve with horizontal asymptote , domain all real and range .
Check. Its values at opposite inputs match those of , since . This confirms the reflection in the -axis.
A sketch should show its defining features clearly, even when it has no detailed grid.
Exam tip
Label the axes, -intercept and asymptote. Write the asymptote as the equation , and let the curve approach it smoothly without touching it. A decay curve passes through , not the origin.
Use the base to identify the next curve without building a long table.
Interpreting exponential models
A multiplier outside the power changes the scale of the outputs, while an added constant moves the graph's horizontal asymptote.
For example, models a quantity that starts at when and multiplies by each unit of time: a increase. A multiplier would retain each step, a decrease. A time model may use only , even though the underlying exponential function allows every real input.
For shifted graphs, work from the expression itself. In , the exponent becomes zero at , so the point on moves right to . Multiplying by moves that point to ; adding moves it to . A negative multiplier reverses the vertical direction.
Reading a shifted exponential
For , where , and :
- the graph of is shifted right by , its heights are multiplied by , then it is shifted up by ;
- the horizontal asymptote is ;
- the point at is ;
- the -intercept is , found by substituting .
The domain is all real . The range is if , and if , because is always positive. The graph never reaches .
Not on the formulae sheet: learn it.
A negative shifts left; a negative shifts down. When , multiplying the exponential part by a negative number reflects its heights before the final vertical shift. The sign of reverses increasing and decreasing behaviour.
[DIAGRAM: asset_name: Reflecting a shifted exponential; asset_slug: shifted-exponentials; caption: Changing the coefficient from 3 to minus 3 reflects the shifted exponential in the line y = 2; description: A shared coordinate plot shows y equals 3 times 2 to the power x minus 1 plus 2 and y equals minus 3 times 2 to the power x minus 1 plus 2. Both approach the dashed horizontal line y equals 2. The points (1, 5) and (1, minus 1) are marked at equal vertical distances above and below that line. The positive-coefficient curve increases and stays above 2; the negative-coefficient curve decreases and stays below 2.]
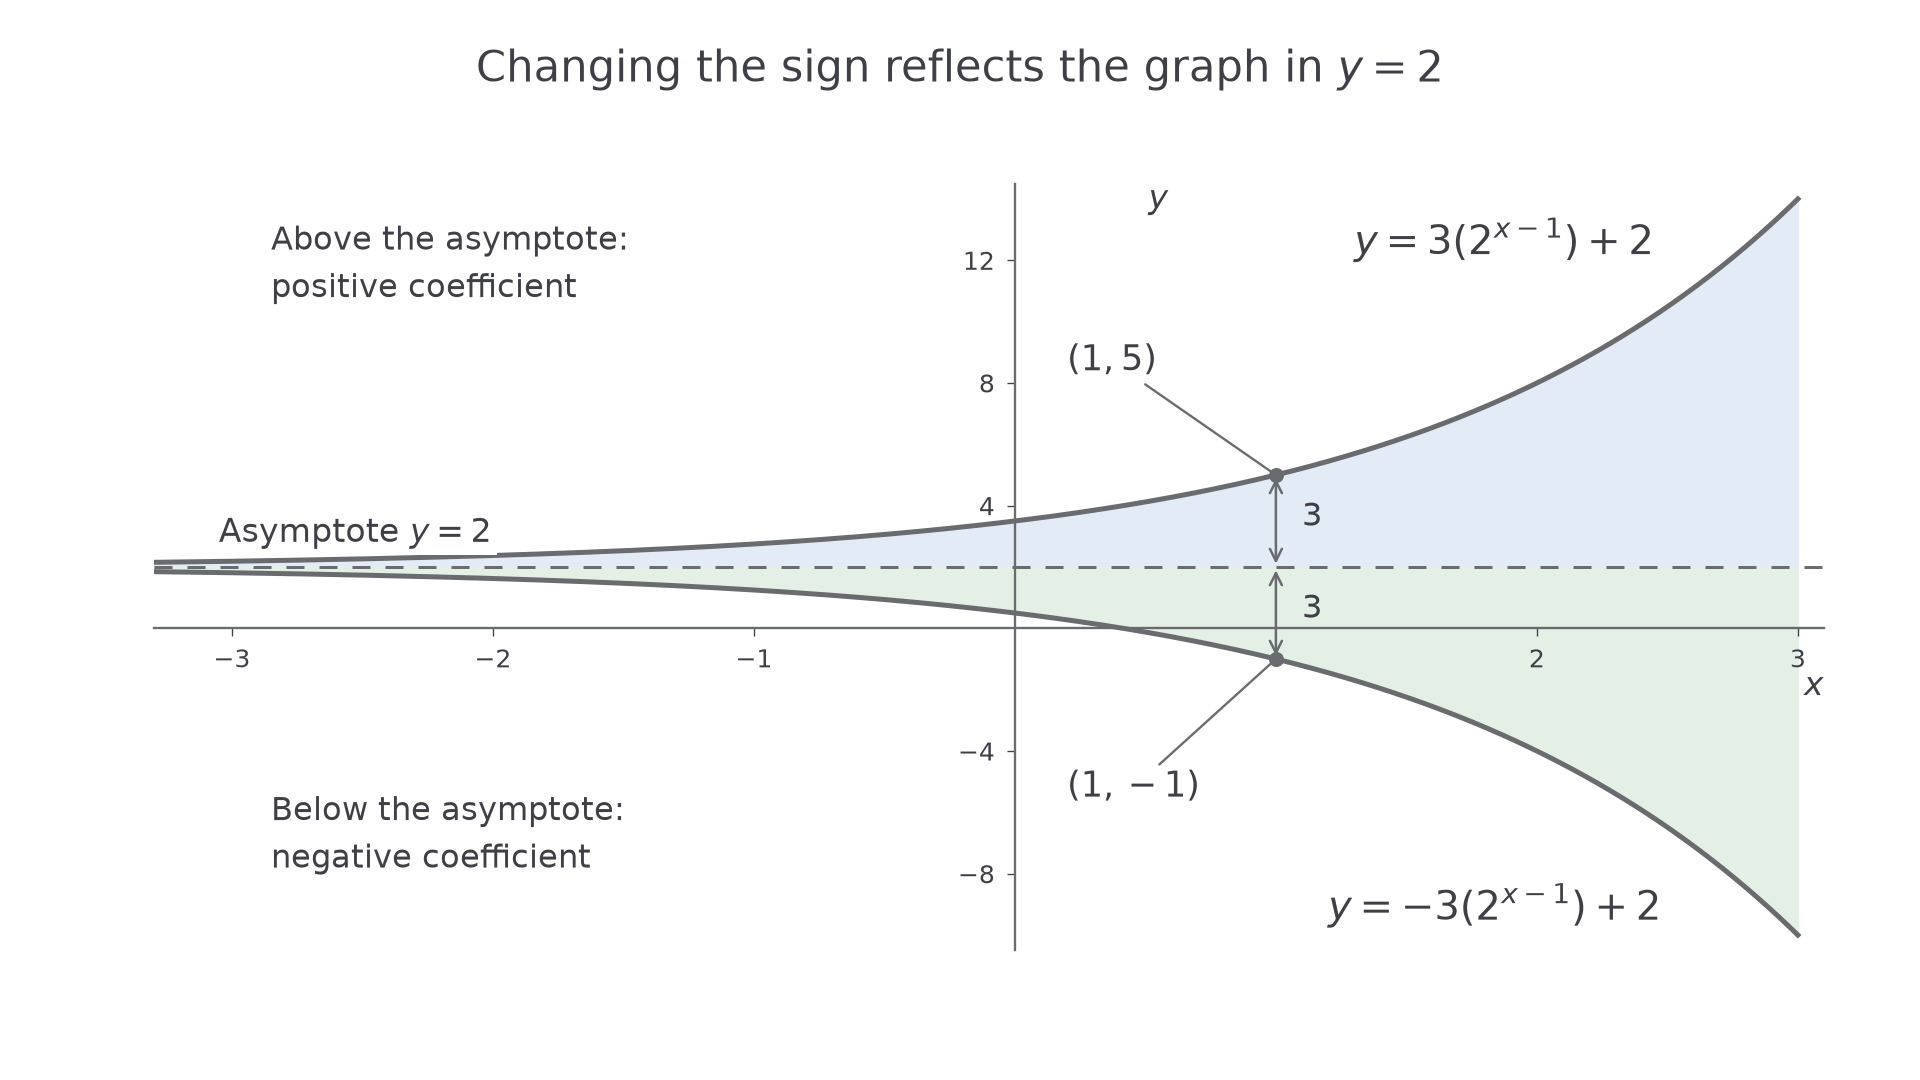
The two curves in the picture have the same base and shifts. Changing only the sign of the coefficient makes their distances from equal and opposite.
Worked example 5: a scale and two shifts
Question. For , find the -intercept, horizontal asymptote and range. State whether the function increases or decreases.
Plan. Substitute , then read the vertical shift and the sign of the exponential part.
As becomes very negative, approaches zero, so approaches . The base exceeds and the coefficient is positive, so the function increases.
Answer. -intercept ; horizontal asymptote ; range ; increasing.
Check. At , the value is . At , it is . The distances from the asymptote are and : they double, as required by the base .
Change only the coefficient from to . The asymptote stays in place, while the side of the asymptote and the direction of change reverse.
Worked example 6: a negative coefficient
Question. For , find the -intercept, horizontal asymptote and range. State whether the function increases or decreases.
Plan. Substitute , then use the negative coefficient to interpret the positive exponential factor.
The exponential factor grows as increases, so its negative multiple becomes more negative. The graph decreases and approaches from below towards the left.
Answer. -intercept ; horizontal asymptote ; range ; decreasing.
Check. At , the value is ; at , it is . Their distances below are and . Also, the two worked-example outputs at any common input add to , confirming reflection in .
With a vertical shift, the output itself no longer has a constant ratio: its distance from the asymptote does. In Example 5, the outputs and do not have ratio , but and do.
Watch out
The coefficient is not automatically the -intercept of . Substituting accounts for both shifts. Likewise, exponential decay from a base below stays positive before any negative coefficient or vertical shift is applied.
The opening half-step multiplier is , because . A scale or vertical shift can move the graph, but the same multiplier rule still controls equal input steps in its exponential part.
Quick Recap
- Equal input steps in give equal multipliers; a step of uses .
- The basic graph passes through , has range and approaches .
- A base above gives growth; a base between and gives decay.
- For , substitute zero for the intercept and use for the asymptote. The sign of determines which side of that line the graph occupies.
A half-step in multiplies its value by ; two such steps multiply by .