10B - Sine, cosine and tangent graphs
Build the three trigonometric graphs from unit-circle values, recognise their repeating patterns and sketch simple transformations. You will use intersections to locate all values in a stated interval, checking its endpoints and the gaps in tangent.
Basic trig graphs
Why does one cycle of sine cross height twice, while one cycle of tangent crosses height only once?
Imagine turning a unit radius steadily anticlockwise. Its vertical coordinate starts at , rises to , falls through to , then returns to . Plotting that height against angle gives the sine curve. The horizontal coordinate gives cosine, beginning at .
| in radians | |||||
|---|---|---|---|---|---|
| in degrees | |||||
| Undefined | Undefined |
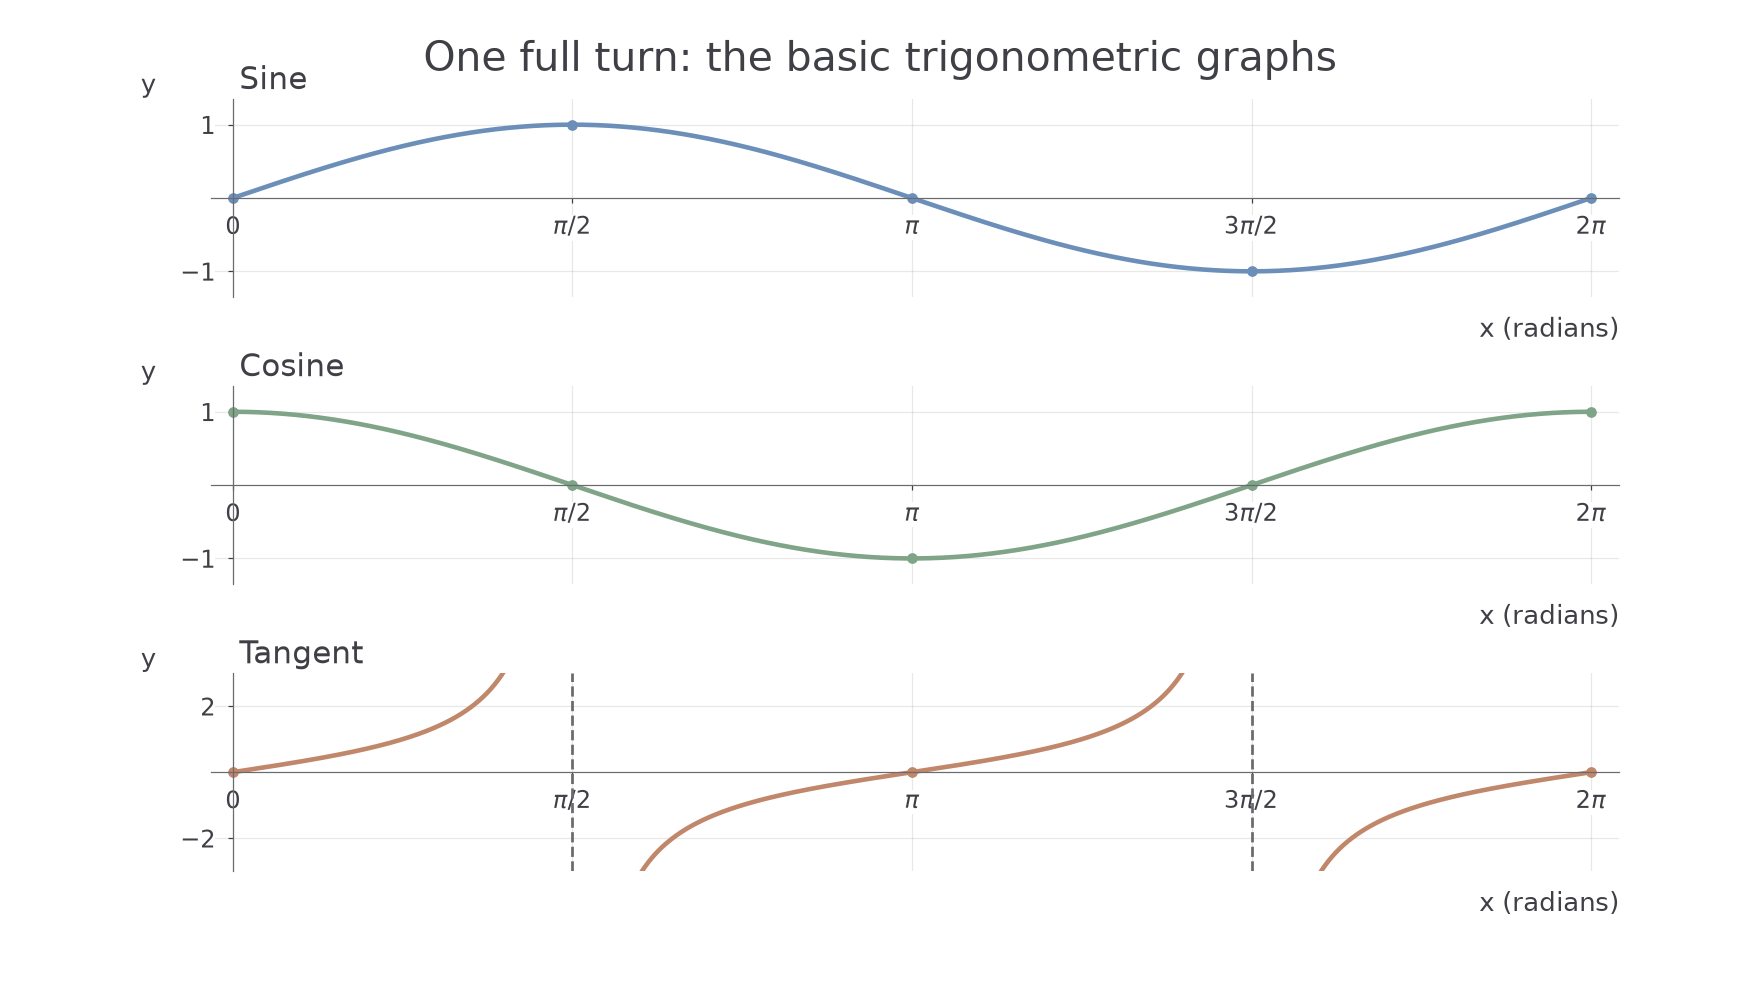
[DIAGRAM: asset_name: Sine cosine and tangent over a full turn; asset_slug: basic-trig-graphs; caption: Sine and cosine repeat after 2 pi radians, while tangent repeats after pi; description: Three aligned angle axes from 0 to 2 pi show sine, cosine and tangent. Key quarter-turn points are marked on sine and cosine. Tangent is drawn in separate increasing branches with dashed vertical asymptotes at pi over 2 and 3 pi over 2, and zeros at 0, pi and 2 pi.]
Period and amplitude
The period is the smallest positive horizontal distance over which the whole graph repeats. Sine and cosine have period radians, or . Their amplitude, the distance from their midline to a maximum, is ; their range is .
Tangent has period radians, or . It takes every real output value and has no amplitude, maximum or minimum.
For all the formulas below, is any integer. Sine has zeros at , maxima at and minima at . Cosine has zeros at , maxima at and minima at . These describe all angles by repeating the first cycle.
Tangent has zeros at and is undefined at . Its graph approaches a vertical line there without reaching it: this line is a vertical asymptote. On each branch, tangent increases from arbitrarily large negative values to arbitrarily large positive values. The apparent jump across an asymptote is a gap in the domain, not a vertical piece of curve. In degrees, replace by throughout these locations.
Worked example 1: sketching a complete sine cycle
Question. Sketch for , marking intercepts, maximum and minimum.
Plan. Locate the quarter-turn values, then join them with a smooth wave.
Sine is negative below the horizontal axis for negative angles in this interval. The curve rises from its minimum through the origin to its maximum, then falls to the right endpoint.
Answer. A smooth sine curve through , , , , . Both endpoints are included.
Check. The interval has length , one period. The negative-angle points reflect the positive-angle points through the origin, as the signed unit-circle heights require.
Keep the same angle interval but change the function to tangent. Its excluded angles force three separate pieces.
Worked example 2: sketching tangent with its gaps
Question. Sketch for , marking zeros and vertical asymptotes.
Plan. Place the zeros and excluded angles first, then draw increasing branches between them.
The zeros are at , and . The asymptotes are and . Use and to guide the central branch. Repeat that shape every .
Answer. Three separate increasing pieces, with included points , and , approaching the two dashed asymptotes without joining across them.
Check. At each asymptote, , so the quotient defining tangent is undefined. At the three zeros, and .
When drawing by hand, mark exact landmarks and a recognisable smooth shape. A sketch needs labelled axes and correct features, rather than a large table of rounded values.
Transformed graphs
Changing a graph's height, spacing or starting position changes a different feature of its formula.
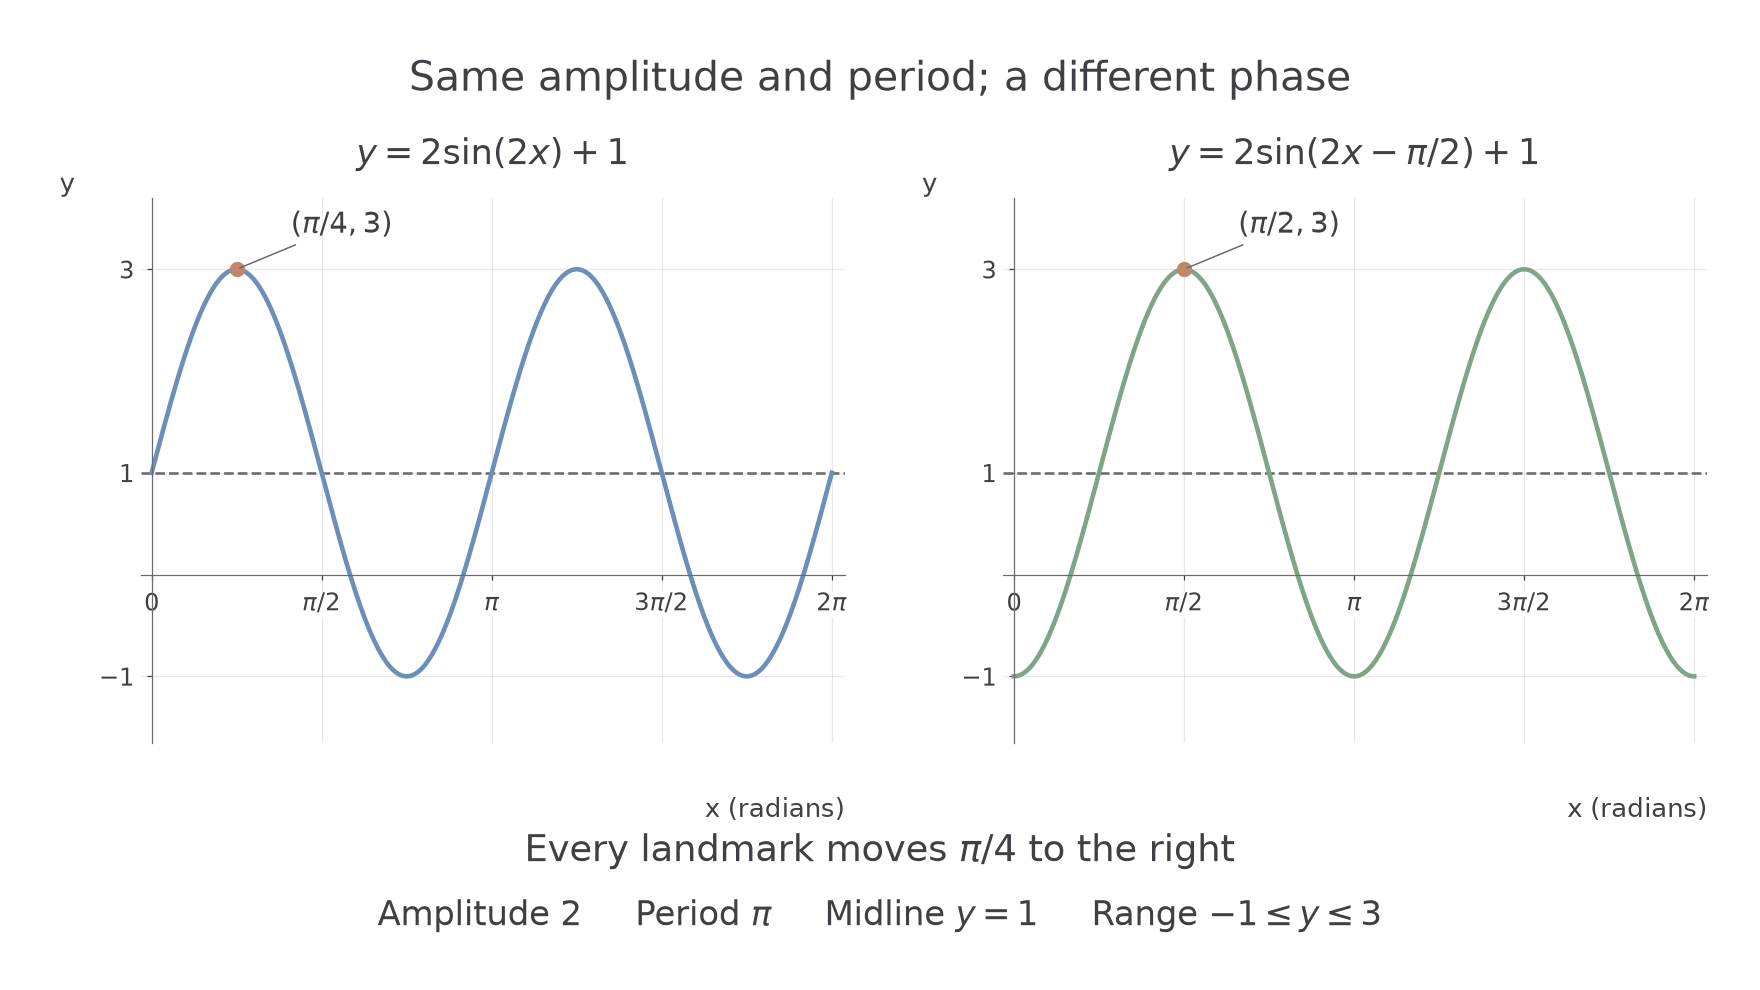
Compare with . The outer doubles each vertical displacement. The added raises the midline to . Inside the sine, completes a full turn when has moved only , so the period is halved.
Reading a transformed sine or cosine
For , or , with and ,
The midline is , the range is , and the horizontal shift is to the right when . A negative shifts left. A negative reflects the curve in its midline.
When is measured in degrees, the period is and must be expressed in degrees. These graph rules are not on the formulae sheet: learn them.
The horizontal shift is also called the phase shift. Equivalent shifts can differ by a whole period. If the input is , factor it as before reading the shift: it is , not simply .
[DIAGRAM: asset_name: A phase shift moves every landmark together; asset_slug: transformed-trig-graphs; caption: A shift of pi over 4 moves the first transformed sine graph to the right; description: Two panels show y equals 2 sin 2x plus 1 and y equals 2 sin of 2x minus pi over 2 plus 1 on the same radian scale. Both have midline 1, range minus 1 to 3 and period pi. Labelled matching peaks move from pi over 4 to pi over 2, a rightward phase shift of pi over 4.]
Continue this lesson.
You’re previewing NovaLearn without an account. Create a free account to read the rest.
Create free account