3.9-3.11 - Rate experiments and collision theory
Rates of reaction tell you how fast reactants are used up or products are made. In this lesson, you will learn how to investigate rate using measurable changes, how common changes affect rate, and how to explain those effects using particle collision theory.
Measuring a rate
A reaction is faster if the same change happens in a shorter time, or if a larger change happens in the same time.
Rate of reaction
The rate of reaction is the change in the amount of reactant or product per unit time.
For a gas-forming reaction, you might measure the volume of gas made every 10 seconds. For a reaction that loses gas to the air, you might measure the decrease in mass on a balance. For a reaction that forms a cloudy solid, you might measure the time taken for a cross underneath the flask to disappear.
Average rate
[DIAGRAM: asset_name: Rate experiments and collision theory - diagram 01; asset_slug: c43_rate_experiments_and_collision_theory__diagram_01; recommended_method: image_gen; description: Monochrome three-panel apparatus overview for investigating reaction rate: gas syringe and stopclock for gas volume over time, balance and cotton wool plug for mass loss over time, and disappearing-cross precipitate method for time to a visible change.]
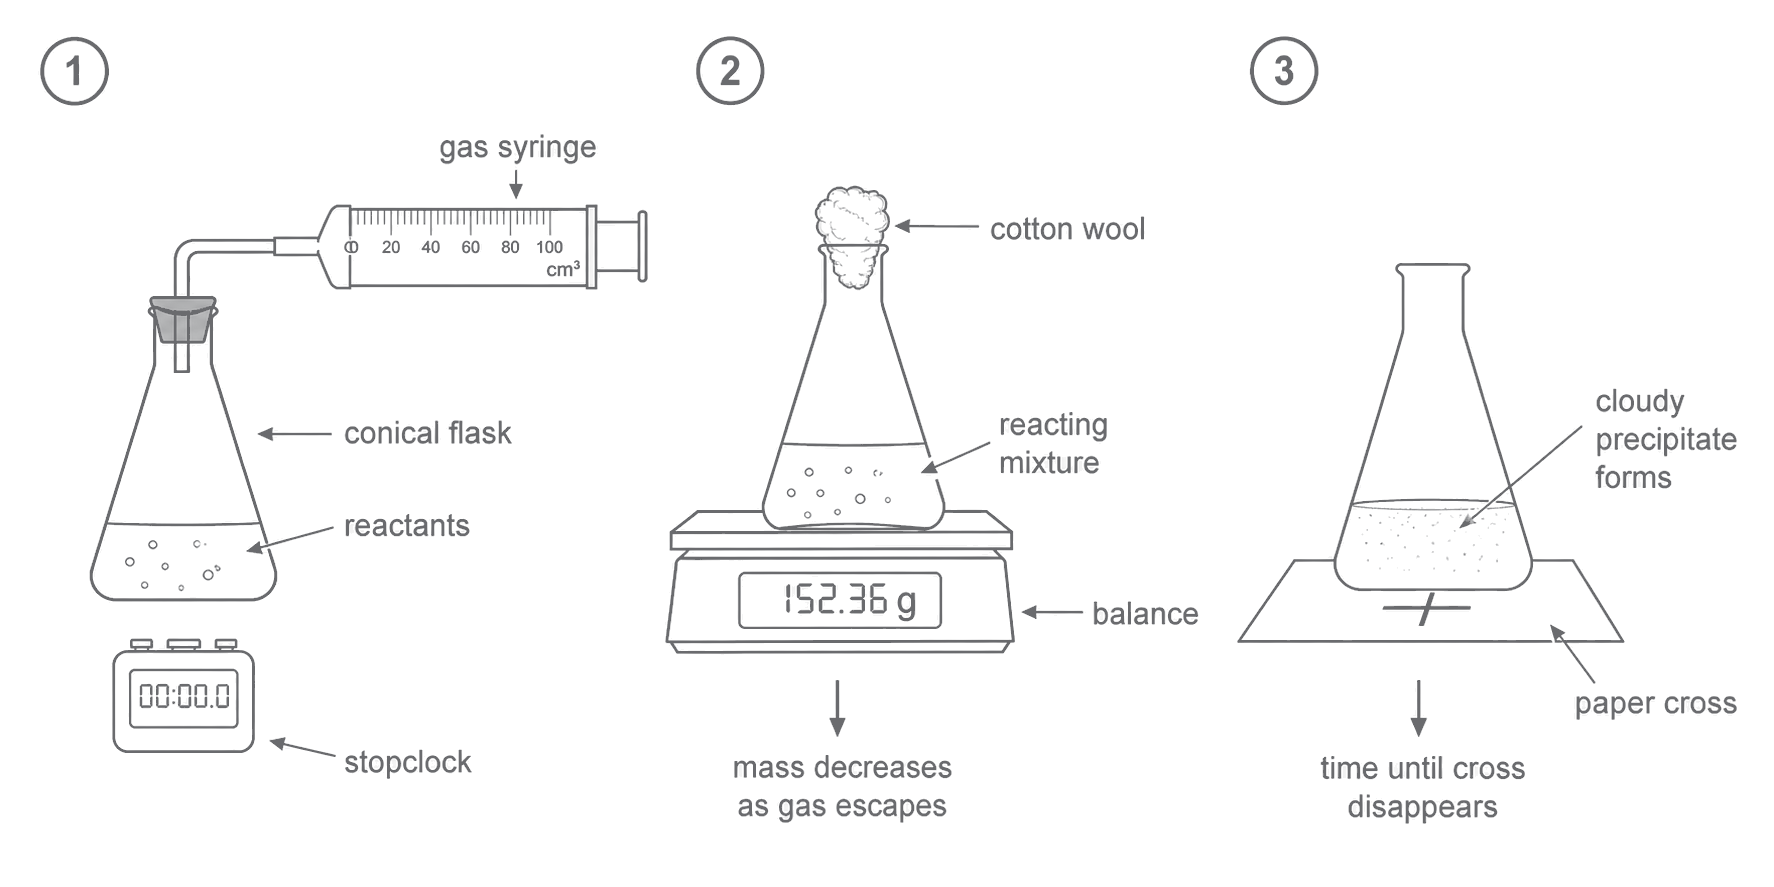
The measurement must match the reaction. A gas syringe is useful only when a gas is produced and collected. A balance works when a gas escapes, so the total mass decreases. A disappearing-cross method works when a solid precipitate forms and makes the mixture cloudy.
For cross experiments, a shorter time means a faster reaction. If you need a numerical rate from this kind of experiment, a simple comparison is often made using:
Fair rate experiments
To investigate an effect on rate, change one independent variable and keep the other important variables the same. Then measure the same dependent variable in each run.
| Effect being investigated | Sensible change to make | Important controls | Possible rate measurement |
|---|---|---|---|
| surface area of a solid | use large pieces, small pieces or powder | mass of solid, volume and concentration of solution, temperature | gas volume over time, mass loss over time, or time for a fixed change |
| concentration of a solution | use different concentrations of one solution | volume of solution, mass/surface area of solid if used, temperature | gas volume over time or time for a visible change |
| temperature | warm or cool the reactants before mixing | concentration, volume, mass/surface area, apparatus | gas volume over time or time for a visible change |
| catalyst | compare the reaction with and without the catalyst | amount and concentration of reactants, temperature, catalyst amount if comparing catalysts | gas volume over time or time for a fixed change |
Good rate experiments usually use repeats and a mean. Repeats help reveal anomalous results, especially when the end point depends on human judgement, such as deciding exactly when a cross has disappeared.
The most common validity mistake is to change two variables at once. For example, if you compare powder with large pieces but also use a different mass of solid, you cannot tell whether the rate changed because of surface area or because there was more reactant.
Rate graphs
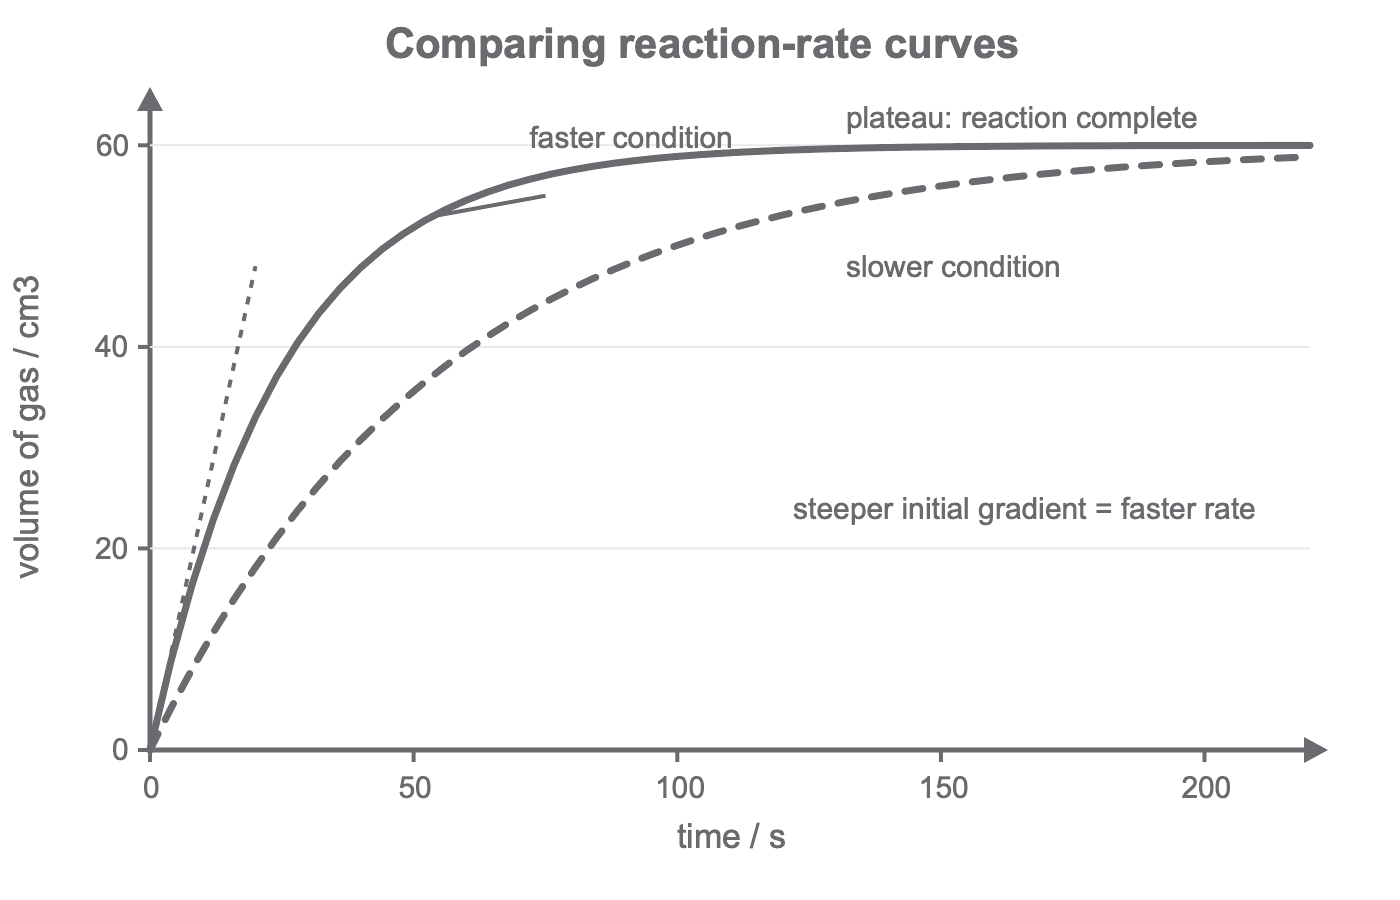
Rate graphs often show a product measurement, such as volume of gas, on the vertical axis and time on the horizontal axis. The rate at any point is shown by the gradient of the curve.
[DIAGRAM: asset_name: Rate experiments and collision theory - diagram 02; asset_slug: c43_rate_experiments_and_collision_theory__diagram_02; recommended_method: deterministic_drawing; description: Deterministic monochrome graph of volume of gas against time showing a faster condition with a steeper initial gradient reaching the same plateau sooner than a slower condition, with labels for gradient and plateau.]
Continue this lesson.
You’re previewing NovaLearn without an account. Create a free account to read the rest.
Create free account