3.5C-3.7C - Energy profiles, bonds and enthalpy from bond energies
Energy changes in reactions can be shown in two connected ways: on an energy profile diagram, and by calculating the energy needed to break and make bonds. This lesson focuses on the separate-science extension: drawing and explaining exothermic and endothermic energy level diagrams, then using bond energy data to calculate the enthalpy change for a reaction. The key exam skill is keeping the sign, the direction of the energy change, and the bonds counted in the same story.
Reading energy level diagrams
An energy level diagram shows how the energy of the reacting substances changes as a reaction happens. The vertical axis is energy. The horizontal axis is the progress of the reaction; it is not time and it normally has no numerical scale.
Energy Level Diagram
An energy level diagram is a diagram that shows the relative energy of the reactants and products in a chemical reaction.
The reactants and products are drawn as horizontal levels. The difference between those levels is the enthalpy change, ΔH.
Enthalpy Change
The enthalpy change, ΔH, is the energy change for a reaction, usually given in kJ/mol.
For this course:
| Diagram feature | What it tells you |
|---|---|
| Reactants higher than products | the reaction is exothermic |
| Products higher than reactants | the reaction is endothermic |
Downward ΔH arrow | energy is released; ΔH is negative |
Upward ΔH arrow | energy is taken in; ΔH is positive |
Some exam energy profiles also show a hump between reactants and products. The height from the reactant level to the top of the hump is the activation energy, E_a. In this lesson you only need it as a labelled energy barrier on the diagram; catalysts and alternative pathways are taught later.
Read the vertical positions first: lower products mean exothermic, higher products mean endothermic.
Exothermic energy profiles
In an exothermic reaction, heat energy is given out to the surroundings. The products are at a lower energy level than the reactants, so the enthalpy change is negative.
[DIAGRAM: asset_name: Energy Profiles, Bonds and Enthalpy from Bond Energies - diagram 01; asset_slug: c41_energy_profiles_bonds_and_enthalpy_from_bond_energies__diagram_01; recommended_method: deterministic_drawing; description: Monochrome energy profile for an exothermic reaction such as H2 + Cl2 -> 2HCl, with energy on the vertical axis, reaction progress on the horizontal axis, reactants higher than products, a smooth activation-energy hump, an upward activation energy arrow from reactants to the peak, and a downward ΔH arrow from reactants to products labelled ΔH negative.]
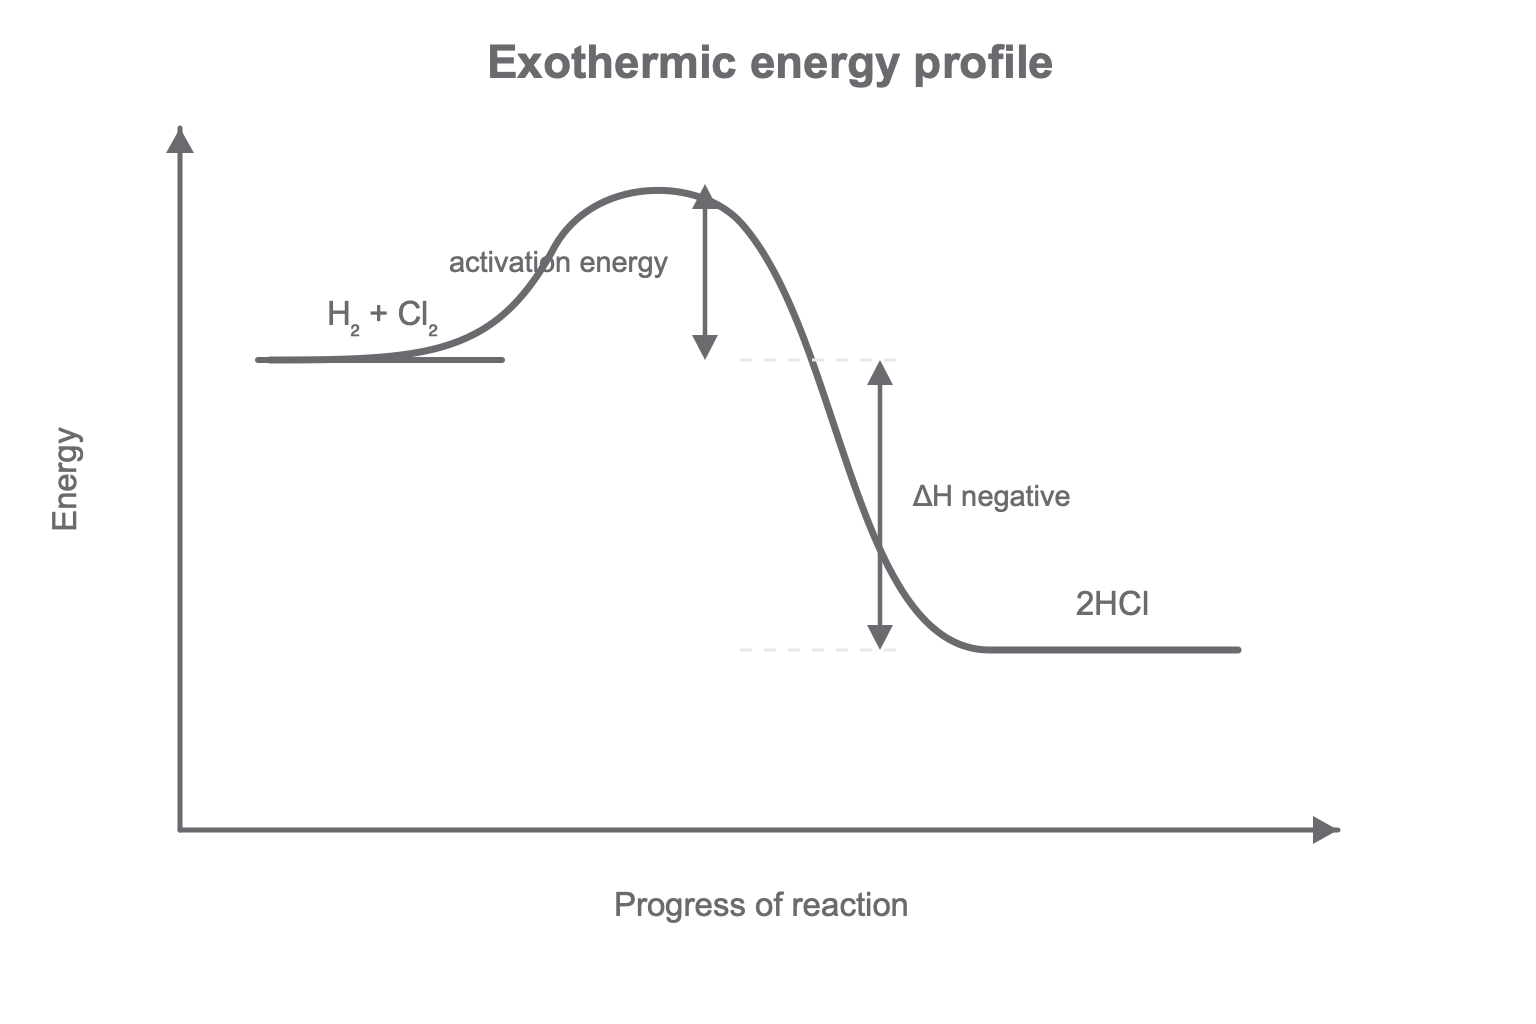
For H2 + Cl2 -> 2HCl, the products have less energy than the reactants. The reaction releases energy overall, so ΔH is negative. If you are asked to draw the diagram, make the product line clearly lower than the reactant line and make the ΔH arrow run from the reactant level down to the product level.
Common Pearson mark-scheme details are:
- horizontal reactant and product energy levels in the correct positions
- correct formulae or names on the correct levels
- an activation-energy hump if the question asks for a profile
ΔHshown as a vertical arrow or line between the two levelsE_aor activation energy shown from the reactant level to the top of the hump
Endothermic energy profiles
In an endothermic reaction, heat energy is taken in from the surroundings. The products are at a higher energy level than the reactants, so the enthalpy change is positive.
[DIAGRAM: asset_name: Energy Profiles, Bonds and Enthalpy from Bond Energies - diagram 02; asset_slug: c41_energy_profiles_bonds_and_enthalpy_from_bond_energies__diagram_02; recommended_method: deterministic_drawing; description: Monochrome energy profile for an endothermic reaction, with energy on the vertical axis, reaction progress on the horizontal axis, reactants lower than products, a smooth activation-energy hump, an upward activation energy arrow from reactants to the peak, and an upward ΔH arrow from reactants to products labelled ΔH positive.]
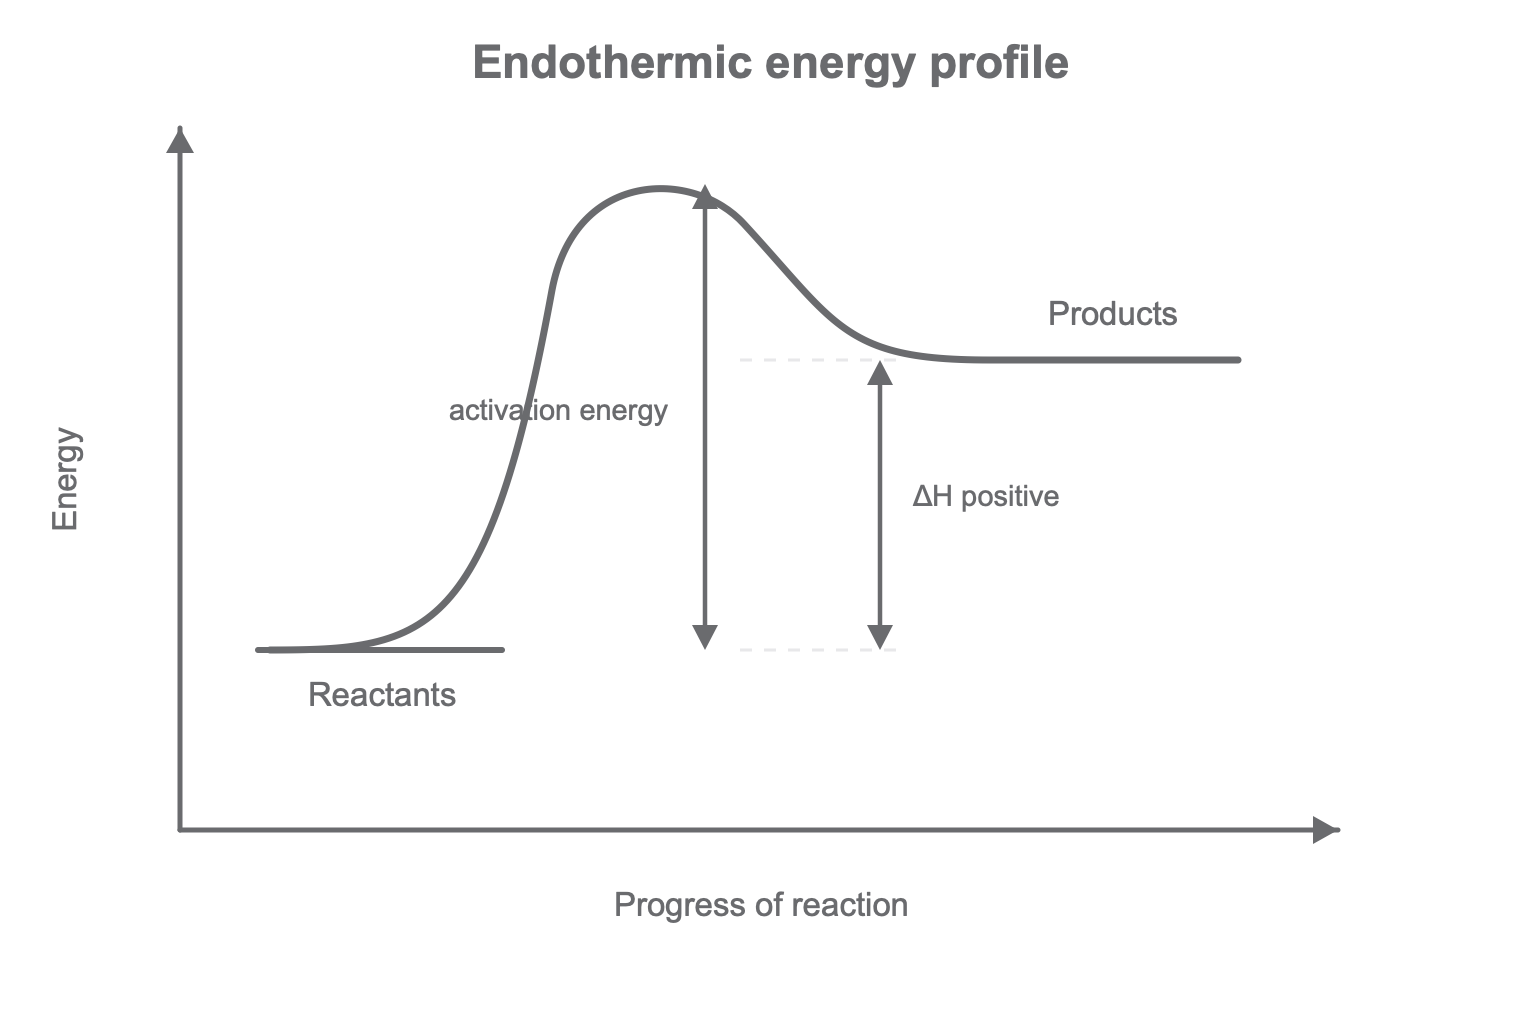
The same diagram rules apply, but the product level is now above the reactant level. A correct endothermic diagram should make it visually obvious that energy has been taken in overall.
Do not decide the type of reaction from the size of the hump. The hump shows activation energy. The exothermic or endothermic label comes from comparing the energy levels of the reactants and products.
Continue this lesson.
You’re previewing NovaLearn without an account. Create a free account to read the rest.
Create free account