3.15-3.16 - Rate practicals - marble chips and hydrogen peroxide
Rate practicals turn a reaction into measurements taken over time. In this lesson, the focus is on two Pearson Edexcel IGCSE Chemistry practicals: marble chips reacting with dilute hydrochloric acid, and hydrogen peroxide decomposing with different solid catalysts. The exam skill is to describe a fair method, process the gas-volume or mass-loss data, and explain what the graph shows without drifting away from the evidence.
What rate practicals measure
A rate of reaction tells you how quickly reactants are used up or products are formed. In these practicals, the easiest product to measure is a gas.
Mean Rate From Gas Volume
For marble chips and hydrochloric acid, the marble is mainly calcium carbonate. It reacts with hydrochloric acid to make carbon dioxide gas:
The carbon dioxide can be collected in a gas syringe. As more carbon dioxide is made, the syringe reading increases.
For hydrogen peroxide, the reaction is a decomposition reaction. Hydrogen peroxide breaks down into water and oxygen:
This reaction is normally slow, so the practical compares different solids to see which ones catalyse the decomposition more effectively. The oxygen can be collected in a gas syringe and tested with a glowing splint, which relights in oxygen.
The practical idea is the same in both cases: measure a changing quantity at regular time intervals, then use the pattern to compare rates.
Marble chips method
This practical investigates two independent variables:
- surface area of the marble chips
- concentration of the hydrochloric acid
[DIAGRAM: asset_name: Rate practicals: marble chips and hydrogen peroxide - diagram 01; asset_slug: c45_rate_practicals_marble_chips_and_hydrogen_peroxide__diagram_01; recommended_method: image_gen; description: Monochrome labelled apparatus diagram for investigating the rate of reaction between marble chips and dilute hydrochloric acid. Show a conical flask containing dilute hydrochloric acid and marble chips, sealed with a rubber bung and delivery tube connected to a horizontal gas syringe collecting carbon dioxide. Include a timer and a comparison inset showing large chips and smaller chips with the same mass but different surface area.]
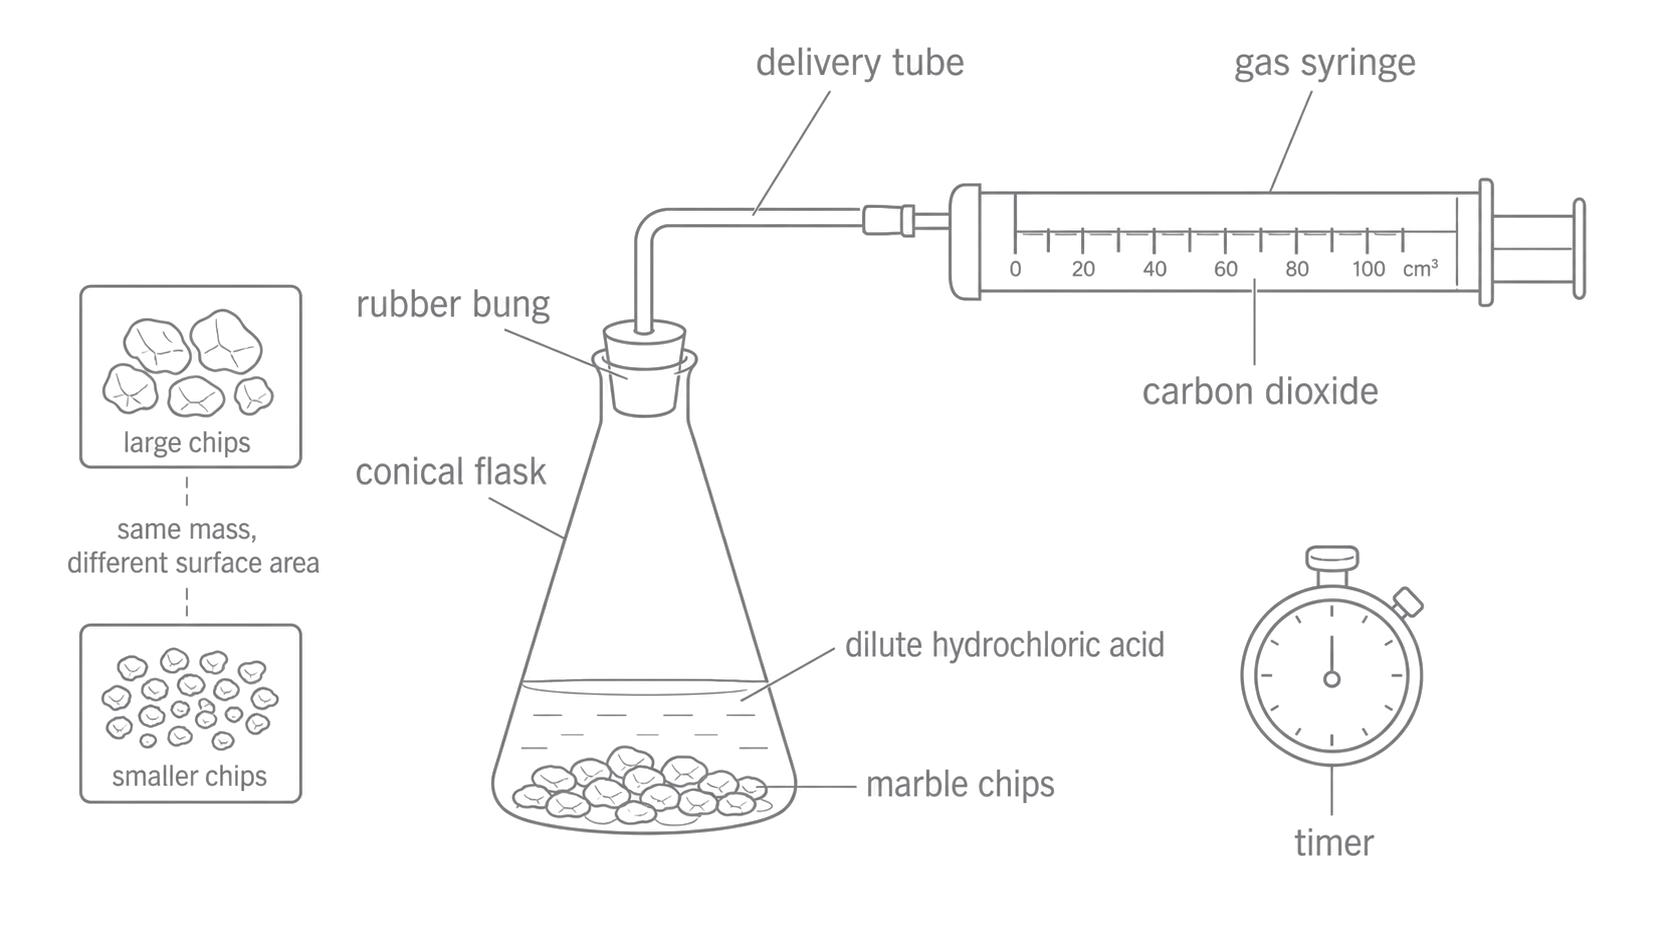
A suitable gas syringe method is:
- Measure a fixed volume of dilute hydrochloric acid into a conical flask.
- Measure a fixed mass of marble chips.
- Add the marble chips to the acid, quickly fit the bung and delivery tube, and start the timer.
- Record the volume of carbon dioxide in the gas syringe at regular time intervals.
- Repeat with different-sized marble chips, using the same mass of chips and the same volume and concentration of acid.
- Repeat with different concentrations of hydrochloric acid, using the same mass and surface area of marble chips and the same volume of acid.
- Repeat trials and calculate means, or identify any anomalous result before calculating a mean.
The comparison must be fair. When testing surface area, only the chip size should change. When testing concentration, only the acid concentration should change.
Independent Variable
The independent variable is the factor deliberately changed in an investigation.
In each run, the independent variable is chosen before the measurements start.
Control Variable
A control variable is a factor kept the same so that the comparison is fair.
Smaller chips have a greater total surface area for the same mass. This usually makes the reaction faster, so the gas syringe reading increases more quickly. A higher concentration of hydrochloric acid also usually makes the reaction faster. If the acid is the limiting reactant, a higher concentration may also produce a larger final volume of carbon dioxide because there are more moles of acid in the same volume.
An alternative method is to place the flask on a balance and record the loss in mass as carbon dioxide escapes. If this method is used, a cotton wool plug can reduce acid spray while still allowing carbon dioxide to leave. The mass decreases because carbon dioxide escapes from the flask; it is not because the chips get smaller on the balance.
Using rate graphs
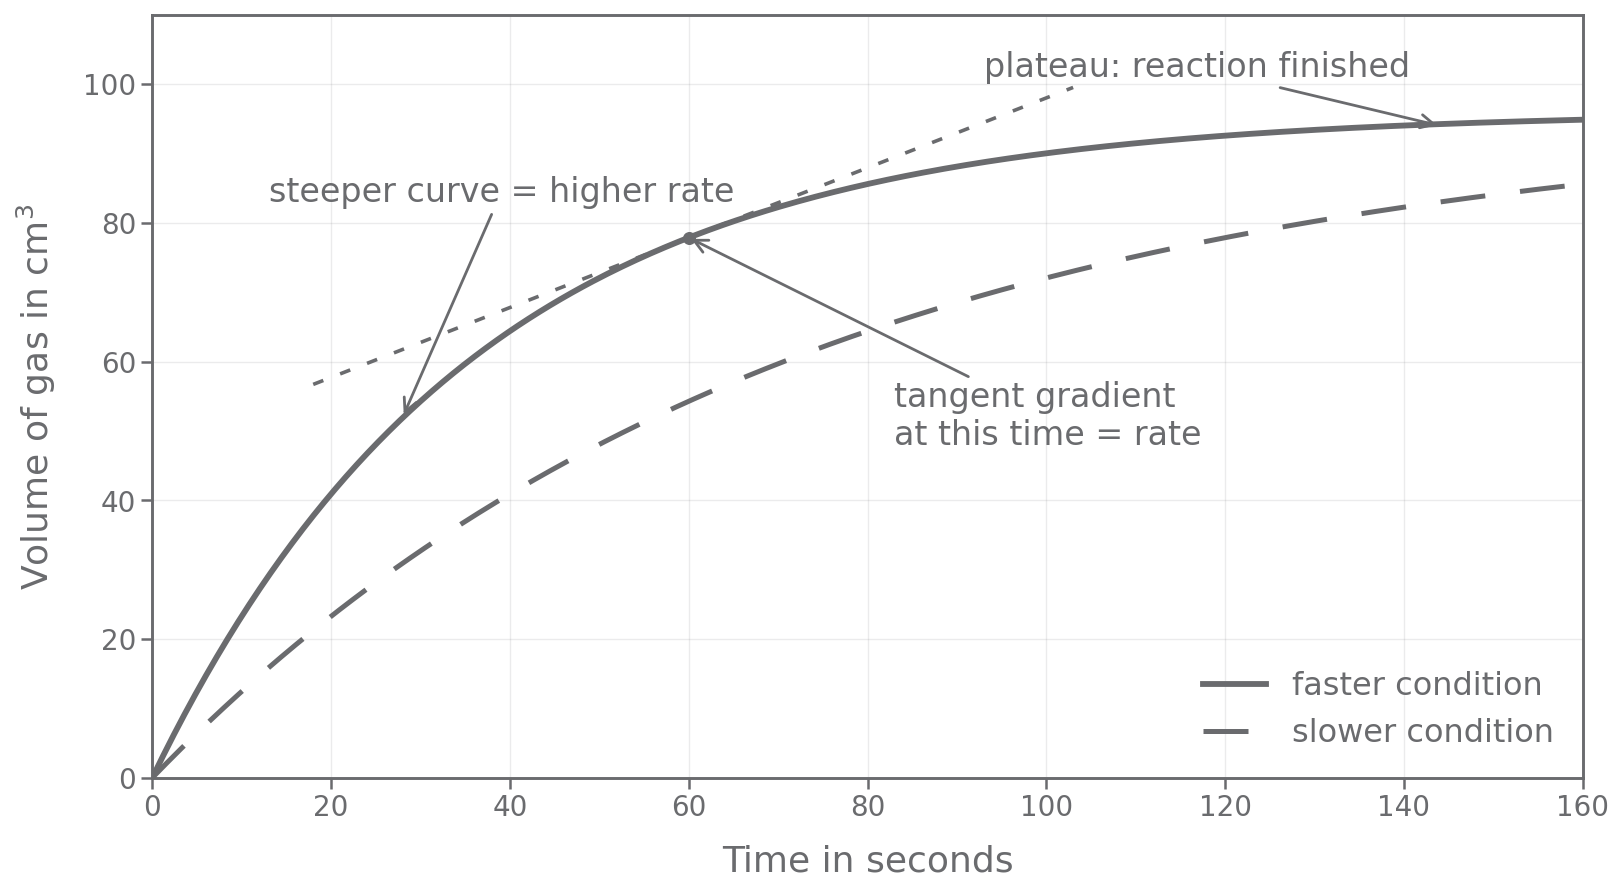
Rate practicals often produce a curve of gas volume against time. The curve is steepest at the start because the rate is greatest at the start. As reactants are used up, the curve becomes less steep. When the curve becomes horizontal, no more gas is being produced.
[DIAGRAM: asset_name: Rate practicals: marble chips and hydrogen peroxide - diagram 02; asset_slug: c45_rate_practicals_marble_chips_and_hydrogen_peroxide__diagram_02; recommended_method: matplotlib; description: Deterministic monochrome graph of volume of gas in cm3 against time in seconds. Show a steeper faster-condition curve and a less steep slower-condition curve, both starting at the origin. Label the steeper curve as higher rate, show a horizontal plateau labelled reaction finished, and show a tangent to one point on the curve labelled tangent gradient equals rate.]
Continue this lesson.
You’re previewing NovaLearn without an account. Create a free account to read the rest.
Create free account