7 - Mathematics and graphs in chemistry
Learn how units, proportions and algebra connect chemical measurements, and how tables and graphs reveal the relationships within results. Worked examples show how to select a method, preserve units and precision, and interpret what a numerical or graphical result means.
Units, standard form and orders of magnitude
A measured quantity combines a numerical value with a unit, so changing units changes the number without changing the physical quantity.
Mass can be measured in kilograms, grams or milligrams; length in metres and their multiples; energy in joules or kilojoules. Scientific quantities also have meanings: a mass is measured with a balance, a volume with suitable volume apparatus, and concentration is determined from the amount of dissolved substance and the solution volume. Name the quantity as well as recording its value.
Prefixes tell us the multiplier applied to a unit:
| Prefix | Symbol | Multiplier |
|---|---|---|
| tera | T | |
| giga | G | |
| mega | M | |
| kilo | k | |
| centi | c | |
| milli | m | |
| micro | µ | |
| nano | n |
Thus , and .
Standard form writes a number as , where and is an integer. For example, 0.00032 is , while 52000 is . A negative power indicates division by a power of ten. Enter the exponent carefully on a calculator and check whether the result ought to be large or small.
Converting a nanoscale length
For a length of , apply the nano multiplier and write the result with a coefficient between 1 and 10.
A nanometre is much smaller than a metre, so a negative power is expected.
Converting a cubic volume
Cubic units need the length conversion cubed. Since :
Converting back, . Dividing by 10 would use a length conversion on a volume and give the wrong result.
An order-of-magnitude comparison uses powers of ten to judge scale. Using typical values of an atomic radius near and a nuclear radius near , their ratio is of order : about ten thousand. This is a scale comparison, rather than a precise size for every atom. Decimal notation and standard form represent the same number; choose the form that makes the scale clear.
Use scientific names consistently too: sodium sulfate and sodium sulfide contain different combinations of elements. Symbols, formulae, names and units each carry information, so a correct number with the wrong chemical identity answers a different question.
Ratios, percentages and sensible estimates
A proportion compares one amount with a relevant total, while a ratio compares amounts with one another.
Converting a ratio into a percentage
A mixture contains of P and of Q. Divide both masses by 6 to simplify the ratio, then divide P's mass by the total to find its fraction.
A ratio of means four parts altogether, so P occupies one quarter of the total.
Use the same basis on both sides of a comparison. A mass ratio counts grams, while an atom ratio counts atoms. Different atoms have different masses, so those ratios need not be equal. If a question asks percentage by mass, use the mass contribution and total mass. If it asks the fraction of particles of a type, count particles instead.
Calculating a percentage reduction
A resource requirement falls from to per equivalent product.
The denominator is the original requirement. Dividing by 60 would compare the reduction with the new requirement.
Estimate before detailed calculation. If a 1.98 g portion is divided among five equal samples, is a useful estimate. The calculated value is . An answer near 4 g is implausible because one part cannot outweigh the 1.98 g total. Estimates can expose a decimal-entry or unit-conversion error even when a calculator produces many digits.
Use units to compare equivalent service: energy per kilogram produced, water per item, or emissions per journey. Two manufacturing routes with different output quantities need a common basis before their totals are compared. A mathematical comparison supplies evidence; the chemical purpose determines which quantity matters.
Algebra, substitution and significant figures
An equation expresses a relationship between quantities, and rearranging it lets us calculate a different unknown.
For mass concentration, , where is dissolved mass and is solution volume. If concentration is in , use mass in g and volume in . To make mass the subject, multiply both sides by : , or . To make volume the subject, divide by : . Carry out the same operation on both sides so the equality is preserved.
Making mass the subject
For and :
The volume units cancel, leaving mass. A quarter of a cubic decimetre contains a quarter of the mass present in one cubic decimetre.
Making volume the subject
A different solution contains at a mass concentration of .
Writing the rearrangement before substitution helps distinguish multiplication from division.
Scientific symbols communicate comparisons as well as equality: means equal; and mean less than and greater than; and indicate much smaller and much larger; means proportional; and can indicate an approximate relationship in a stated context. In a relationship , doubling doubles , while in , doubling halves . Proportionality describes a relationship under stated conditions, not a reason to assume every graph is a straight line.
Significant figures express the useful numerical precision of a value. Leading zeros locate the decimal point; they do not count as significant. In 0.00470, the significant digits are 4, 7 and the final 0, giving three significant figures. Standard form makes that precision clear. A trailing zero can matter: 4.7 has two significant figures, while 4.70 has three.
Use unrounded intermediate results and round once at the end. For , three significant figures give 14.0 because the next digit causes the third significant digit to round upward. Reporting 14.0 preserves three significant figures. Extra calculator digits do not make measurements more certain. Follow the requested precision; if none is requested, use a precision appropriate to the measurements and purpose.
Frequency tables, bar charts and histograms
A frequency records how many observations belong to a category or numerical interval.
Illustrative material-test data give 3 successes for P, 5 for Q and 2 for R. A frequency table lists each category and its count. To make a bar chart, put categories on the horizontal axis and frequency on the vertical axis, choose an equal scale and draw bars of equal width. Leave gaps between bars because P, Q and R are separate categories.
The summed count must match the number of recorded outcomes.
Continuous measurements can be grouped into intervals. A second dataset contains masses , , , , , , and . Count each in one interval, including lower limits and excluding upper limits:
| Mass interval in g | Frequency |
|---|---|
| 2 | |
| 3 | |
| 2 | |
| 1 |
For the second interval, , and lie within the limits.
Checking the total against the eight measurements helps catch a missing or double-counted value.
In a histogram, the horizontal axis is a numerical measurement scale and adjacent bars touch because the intervals are continuous. For these equal-width intervals, frequency heights 2, 3, 2 and 1 correctly show the distribution. Include the class boundaries on the axis. If interval widths differ, frequency heights alone can mislead; an area-based scale is needed, so do not silently use the equal-width rule for unequal intervals.
[DIAGRAM: asset_name: Categories and continuous measurement distributions; asset_slug: 8462_c75_distributions; caption: Separate categories use a bar chart with gaps, while equal continuous mass intervals use a histogram with touching bars.; description: Two exact illustrative plots. The left has category frequencies P3, Q5 and R2 with gaps. The right has mass intervals 0.95 to 1.00, 1.00 to 1.05, 1.05 to 1.10 and 1.10 to 1.15 grams, with frequencies 2, 3, 2 and 1 and touching bars.]
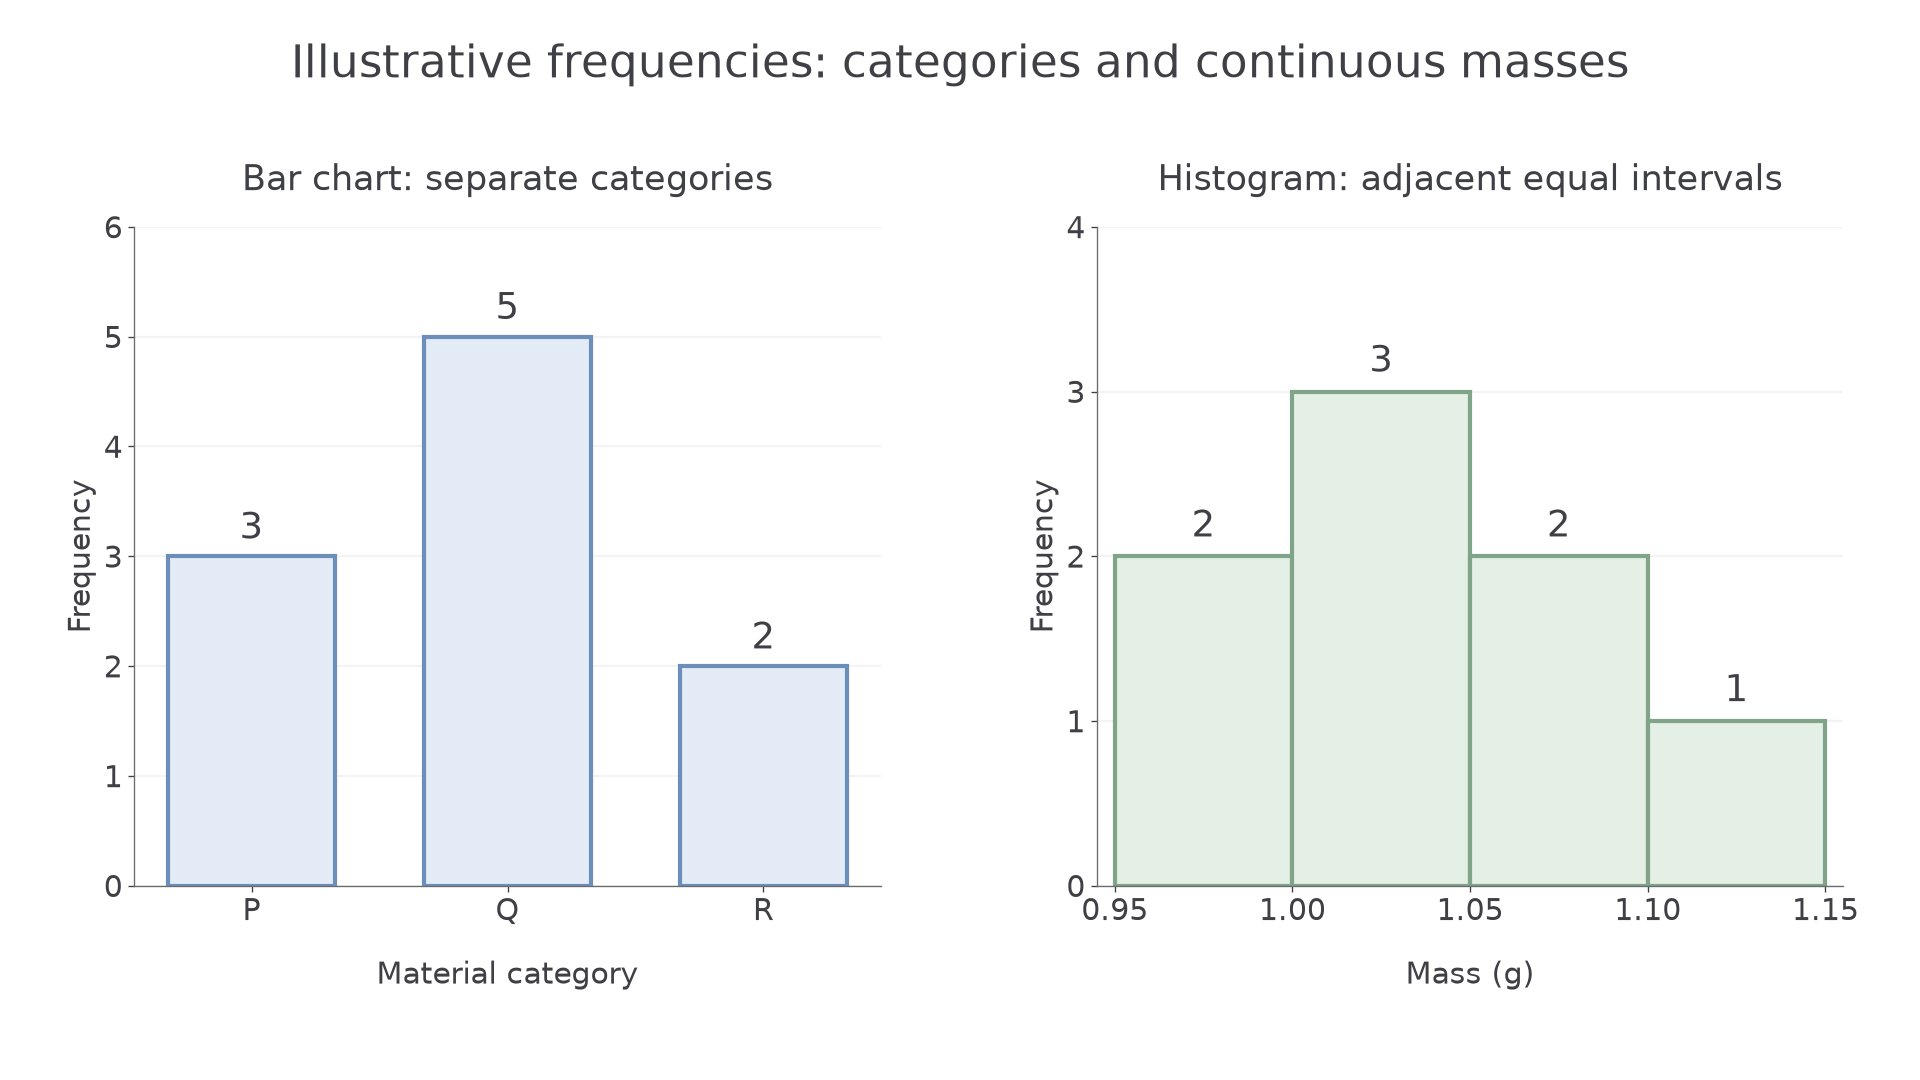
Interpret the distribution as well as constructing it. The most frequent interval here is 1.00–1.05 g, and all observations lie between 0.95 and 1.15 g. The grouped table preserves counts and spread but loses each exact reading. Use the original values, rather than interval boundaries, to find an exact arithmetic mean when those values are available.
Straight-line graphs, gradients and intercepts
A graph of two numerical variables shows how one changes as the other changes.
Place the independent variable on the horizontal axis and the dependent measurement on the vertical axis. Label each axis with its quantity and unit. Choose evenly spaced numerical scales large enough to display the pattern, plot each coordinate in horizontal-then-vertical order, and draw an appropriate best-fit line or curve. A best-fit line represents the overall trend rather than joining every fluctuation between adjacent readings.
These Illustrative calibration readings show a straight-line relationship:
| Concentration in | Instrument reading in arbitrary units |
|---|---|
| 0 | 5 |
| 1 | 9 |
| 2 | 13 |
| 3 | 17 |
Gradient, intercept and an unknown concentration
The gradient is vertical change divided by horizontal change. Use widely separated points on the line.
Each increase of corresponds to four instrument units. The vertical intercept, 5, can represent a background reading present when concentration is zero.
The straight-line form is , where is the gradient and the vertical intercept. Symbols take their meanings from the definitions: here is a gradient, while earlier it represented mass. The example is . For a reading of 15:
This is between the concentrations 2 and 3, matching its position between readings 13 and 17.
Finding an intercept from two non-zero points
A second calibration line passes through and , with concentration in and reading in arbitrary units. First calculate its gradient, then substitute a point into .
A reading of 11 gives . Substitution checks it: . The reading must have its background removed before division by the gradient.
Continue this lesson.
You’re previewing NovaLearn without an account. Create a free account to read the rest.
Create free account