4.6.1.2 - Investigating concentration and rate
Required practical 5 investigates how concentration affects reaction rate using both gas-volume measurements and a colour or turbidity change. Learn to develop a testable hypothesis, control conditions, collect results by both methods, and judge what the measurements can establish.
A concentration hypothesis and fair comparisons
A concentration investigation tests a particle-based prediction by changing concentration and measuring how quickly a reaction proceeds.
Collision theory suggests the hypothesis: increasing reactant concentration increases the reaction rate when other conditions are unchanged. More reactant particles in a fixed volume collide more frequently, so there are more successful collisions per second. Under a simple model, doubling concentration may approximately double initial rate; testing the trend is more defensible than assuming an exact numerical relationship for every reaction.
Use the same stock solution and dilute it with water to produce a range of concentrations. Keeping the total diluted volume constant separates concentration from volume.
This assumes mixing does not appreciably change the total volume.
Worked example 1 — one fifth of the stock concentration
Prepare a sample from of stock solution:
This is 20% of the stock concentration, rather than 20% pure chemical.
Worked example 2 — a more concentrated sample
Use of the same stock solution in a final :
The final volume is unchanged but the stock amount doubles, so the concentration doubles. The volumes of stock and water sum to the intended final volume in both examples.
Concentration is the independent variable. The dependent measurement might be gas volume produced in a fixed time, or time to a fixed turbidity endpoint. Keep temperature, total solution volume, other reactants, apparatus and the starting procedure constant. For a solid, also control its mass and surface area. For an optical endpoint, control the depth of liquid, viewing conditions and endpoint judgement.
A preliminary trial helps choose a safe range that gives measurable changes. Extremely fast reactions may finish before the apparatus is ready; extremely slow ones increase timing and temperature-control difficulties. Choose measuring cylinders for liquid volumes, a balance for solid mass, a stopwatch for time, a thermometer for temperature and a suitable gas syringe for gas volume. Their ranges and resolutions must fit the experiment. Repeated trials show consistency and allow means, while a wide enough concentration range reveals a trend.
Measuring gas production over time
A gas-volume method records product accumulating, allowing reaction curves to be compared across concentrations.
Use calcium carbonate chips with hydrochloric acid:
The carbon dioxide can be collected in a gas syringe. For a concentration comparison, use the same mass, for example , of similar-sized chips from the same batch. Use of acid at each selected concentration. Preliminary work should establish that even the least concentrated acid is in excess, so the carbonate controls the final amount of gas. No mole calculation is needed to carry out this method.
[DIAGRAM: asset_name: Gas-volume rate apparatus; asset_slug: 8462_c43_gas_volume_method; caption: Carbon dioxide passes from the reaction flask into a gas syringe whose plunger can move freely.; description: A conical flask holding acid and calcium carbonate chips is connected through a bung and delivery tube to a horizontally supported gas syringe. Labels show liquid, solid, gas path, scale, freely moving plunger and stopwatch. The syringe is supported without clamping the moving plunger.]
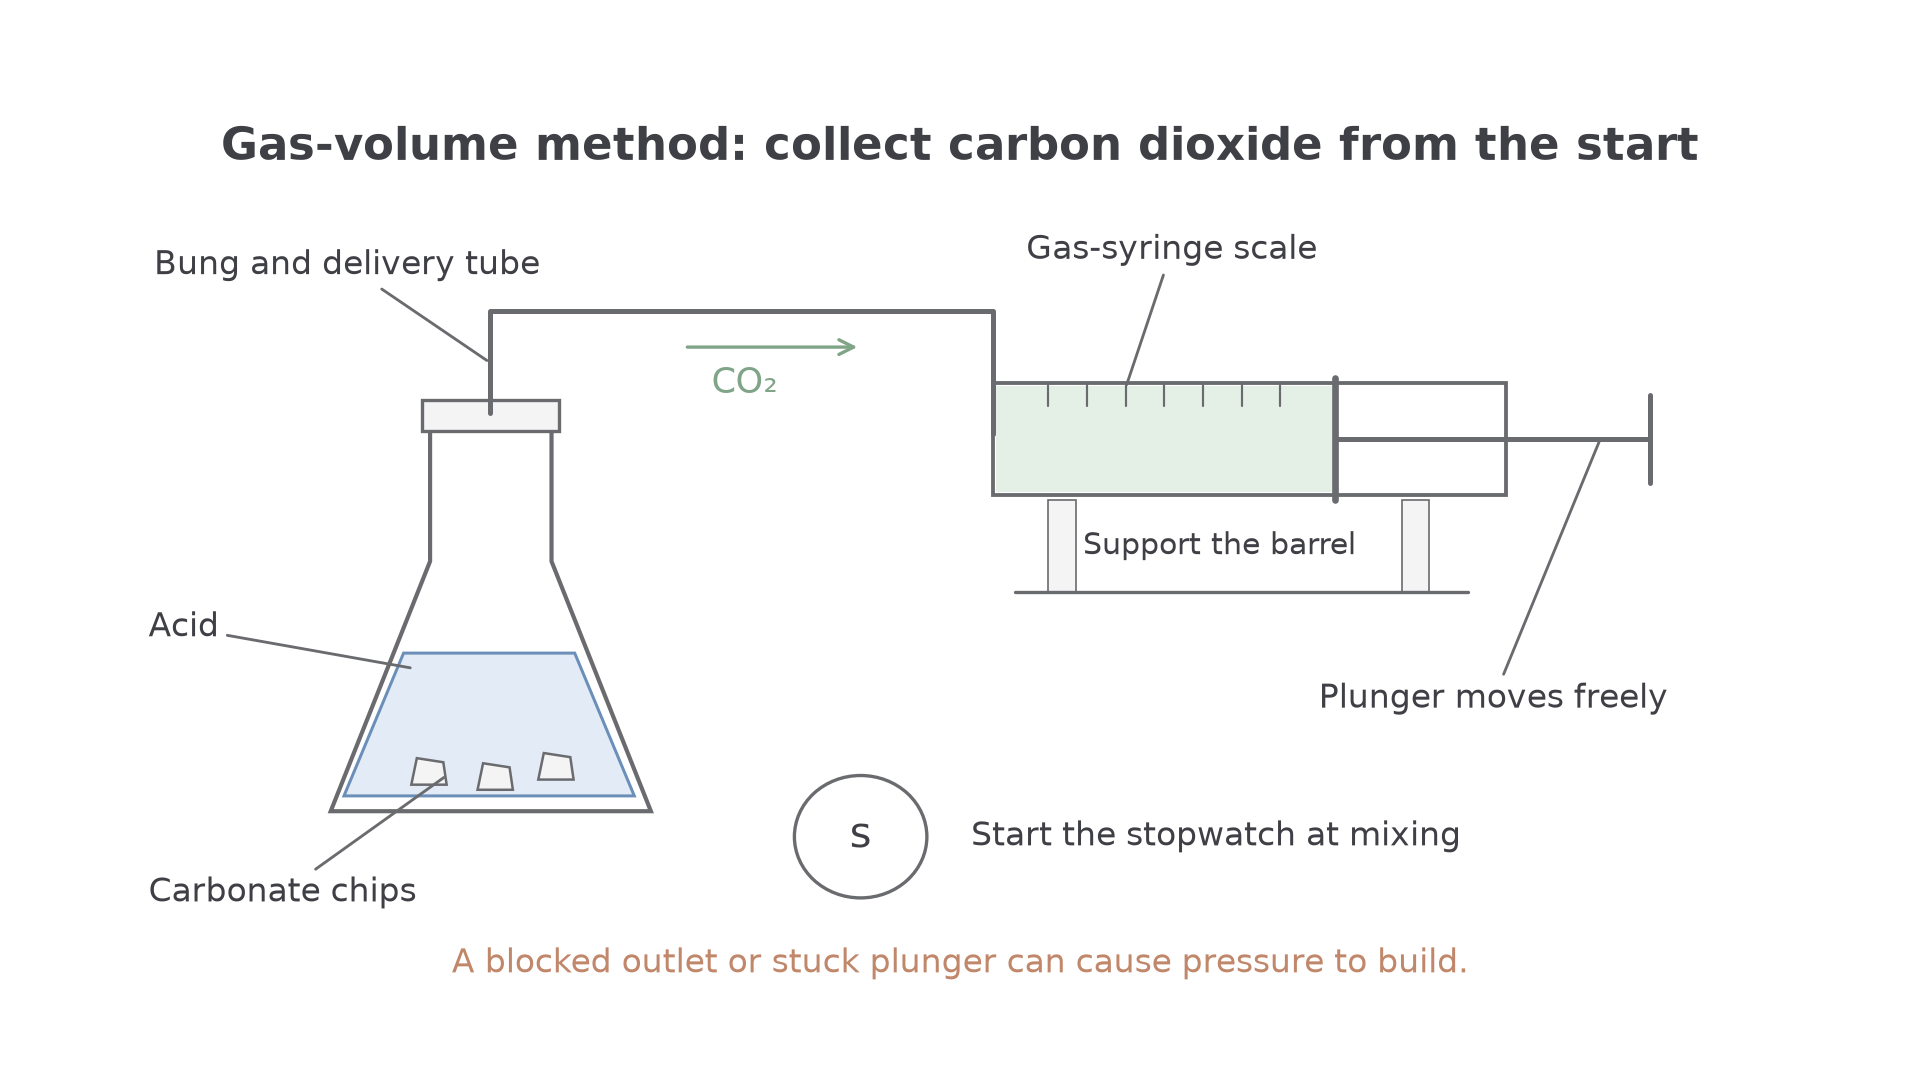
- Check the bung and tube fit securely and the syringe moves freely. Set the syringe to zero and select a capacity above the expected gas volume. Support it without obstructing its plunger.
- Measure the acid sample and check its temperature. Weigh fresh carbonate chips and keep their size distribution as similar as possible between runs.
- Mix the reactants, start the stopwatch immediately and fit the bung promptly. Use the same sequence each time. A suitable arrangement that keeps reactants separate inside a closed connected flask until tilting can reduce gas loss at the start.
- Record syringe volume every or , continuing until the reading stops increasing. Record bubbling as an observation, but use measured volume and time for the rate comparison.
- Repeat each concentration using fresh reactants, rinsed apparatus and matched starting conditions. Check for leaks, sticky plungers or an unexpectedly small final volume.
Wear eye protection, handle the acid carefully and avoid splashing. The outlet must lead to a freely moving gas syringe: a blocked outlet or stuck plunger can allow pressure to build. Do not deliberately seal gas production into a rigid closed vessel. Collect and dispose of solutions as directed by the teacher's risk assessment.
Plot gas volume against time for each concentration on the same axes. A steeper initial curve means a faster initial rate. Under equal collection conditions, the same final plateau is expected if equal carbonate amounts react fully and acid is in excess. A higher plateau instead may indicate different amounts reacted, leaks or changed gas conditions; it does not on its own prove a faster rate.
Worked example 1 — the lower-concentration run
Illustrative gas-volume data: the 20%-stock acid produces in the first , while 40%-stock acid produces in that interval. For the first run:
Worked example 2 — the higher-concentration run
For the second run, use its own volume over the same time:
This supports a doubled mean rate over the interval. Further repeats and concentrations are needed to establish a wider relationship; one comparison does not prove exact proportionality at every concentration.
Timing a turbidity change
A turbidity method times how long a reaction takes to reach the same visible cloudiness rather than collecting a gas.
Turbidity is cloudiness caused by suspended particles. Sodium thiosulfate solution reacts with dilute hydrochloric acid, producing solid sulfur. The sulfur makes the mixture progressively cloudy until a black cross beneath the flask can no longer be seen. The reaction also produces sulfur dioxide, so use small quantities in suitable ventilation and follow the teacher's risk assessment; do not lean over the flask or inhale the gas.
Continue this lesson.
You’re previewing NovaLearn without an account. Create a free account to read the rest.
Create free account