4.10.2.1 - Life cycle assessments
Learn how to compare the environmental impacts of products throughout their lives, calculate meaningful comparisons from data, and explain why a life cycle assessment depends on boundaries and value judgements.
Stages in a product's life cycle
A life cycle assessment follows a product from its raw materials to the end of its useful life.
A life cycle assessment (LCA) assesses environmental impacts at each stage. Looking only at the product in a customer's hand misses much of the resource use and waste involved in providing it. A cotton bag, for example, requires growing and processing cotton before it can be sewn, and may need washing during use.
| Stage | Questions an LCA investigates |
|---|---|
| Extracting and processing raw materials | What resources are removed or grown? How much water and energy are used? What wastes are produced? |
| Manufacturing and packaging | What energy and materials turn the feedstock into a finished product and protect it? |
| Use and operation during its lifetime | How long does it last? Does using it require fuel, electricity, water, washing or maintenance? |
| Disposal at the end of useful life | Is it reused, recycled, incinerated or put in landfill? What resources are recovered and what wastes remain? |
Transport and distribution belong at every relevant stage, not just the journey to the customer. Raw materials travel to factories, products travel to shops, and discarded products travel to treatment facilities. Transport impacts depend on factors such as mass, distance and the energy source used.
The comparison needs a common service. Comparing one thin carrier bag with one stronger bag is incomplete if the stronger bag is used many times. A fair question might compare materials needed to carry the same amount of shopping on ten journeys. Likewise, two light bulbs should be compared for the same amount of useful lighting, rather than simply for one bulb each. State the assumptions about lifespan, reuse and disposal so the conclusion has a clear meaning.
Quantitative comparisons
LCA data can be compared numerically when the measured quantities and the service being provided are clear.
Water use, resource quantities, energy use and the masses of some wastes can be measured or estimated in familiar units. Add values only when they describe the same quantity in the same units. Energy in megajoules cannot be added directly to water in litres to make an unweighted “total impact”. Keep those comparisons separate.
The illustrative table compares the energy used to supply the same ten carrying journeys. It already includes the stated transport and disposal assumptions.
| Stage | Paper system energy (MJ) | Plastic system energy (MJ) |
|---|---|---|
| Raw materials | 3.2 | 2.0 |
| Manufacturing and packaging | 4.8 | 2.4 |
| Use | 0.0 | 0.0 |
| Disposal | 1.0 | 0.6 |
| Total | 9.0 | 5.0 |
Comparing total energy and percentage changes
Add each system's stage values, then select the baseline specified in the comparison.
The difference is the same , but the percentage changes differ because their denominators differ.
Comparing water use separately
For equal useful lighting, two lamp systems have whole-life water demands of and . These values concern water, so they are kept separate from the energy table.
The reduction is one fifth of the original . Adding it to an energy saving in MJ would not produce a meaningful unweighted total.
[DIAGRAM: asset_name: Illustrative energy comparison through the life cycle; asset_slug: 8462_c65_lca_energy; caption: Stacked bars show the contributions to 9.0 MJ for paper and 5.0 MJ for plastic for the same ten journeys.; description: An illustrative stacked energy chart with raw-material, manufacture-and-packaging, and disposal segments. Paper segments are 3.2, 4.8 and 1.0 MJ; plastic segments are 2.0, 2.4 and 0.6 MJ. Use contributes zero in this particular dataset. Transport is included within the stated stage values.]
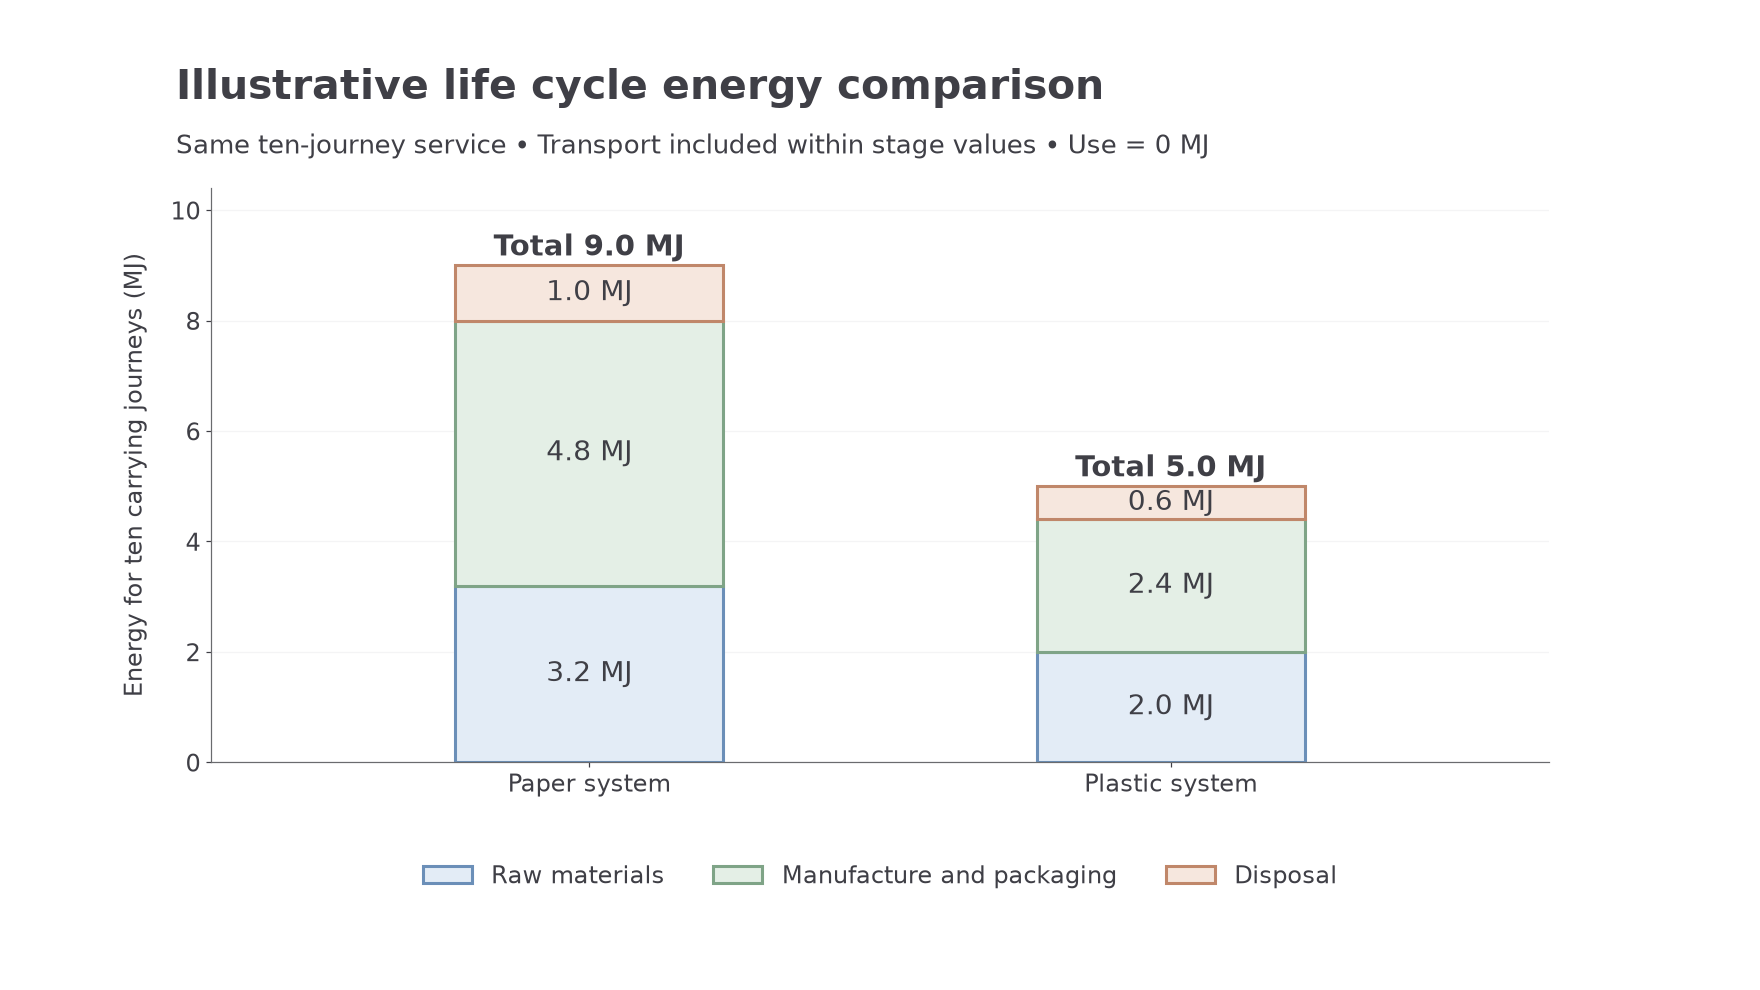
Estimate before calculating: totals near 9 and 5 suggest a ratio near 2, so a result of 18 is implausible. Give a precision suited to the data; a calculated reduction of 44.444…% does not justify reporting every digit when the inputs have only two significant figures. A bar chart can reveal which stage dominates, but use its axis scale to read a value rather than judging an unlabelled bar by appearance.
Continue this lesson.
You’re previewing NovaLearn without an account. Create a free account to read the rest.
Create free account