4.6.1.1 - Measuring rates and interpreting rate graphs
Reaction rate describes how quickly reactants are used or products are formed. Learn to calculate mean rates, draw and interpret quantity–time curves, recognise tangent slopes and connect a rate's unit to the quantity measured.
Mean rate and its units
Mean rate compares the amount of chemical change with the time taken for that change.
or
Measure a quantity that changes because of the reaction. A gas syringe can measure the volume of gaseous product in . A balance can measure a decrease in the apparatus mass when a gaseous product escapes; that mass loss measures the escaped product, not disappearance of all matter. Reactants can also be measured directly where an appropriate method is available. Temperature change alone is not a quantity of reactant used or product formed.
Worked example 1 — gas volume
A reaction produces of gas in . Divide product volume by elapsed time:
Multiplying back, , checks that the result describes the measured amount.
Worked example 2 — mass and a time conversion
Another reaction uses of reactant in 2 minutes. Convert the time before calculating a per-second rate:
The unit follows the measured quantity: mass gives , volume gives . Dividing by 2 would give grams per minute rather than grams per second.
For an interval after the reaction has started, use changes in quantity and time. If gas volume rises from to between and , the interval mean is . Dividing 36 by 30 would give the mean from the start if the initial volume were zero, not the requested interval mean.
Mean rate hides changes within its interval. A reaction can be fast initially and slow later while still having one mean for the entire run. Compare measurements of the same quantity and reaction conditions; a gas-volume rate and a mass-loss rate cannot be compared by their numbers alone because their units and measured substances differ.
Drawing and reading quantity–time curves
A quantity–time curve shows both how much change has occurred and how its speed varies during a reaction.
Put time on the horizontal axis and the measured quantity on the vertical axis. Label units, choose regular scales, plot the data accurately and draw a suitable smooth best-fit curve. Do not force a curve through an anomalous point or join each point with a sharp zigzag unless the data justify straight segments.
These illustrative gas-production data describe a smooth reaction model:
| Time in | 0 | 20 | 40 | 60 | 80 | 100 | 120 |
|---|---|---|---|---|---|---|---|
| Gas produced in | 0.0 | 21.6 | 38.4 | 50.4 | 57.6 | 60.0 | 60.0 |
The product curve starts at zero, rises rapidly, becomes less steep and finally levels off at . Its height tells you the accumulated product, while its slope tells you the rate. At there is more product than at , but production is slower because the curve is flatter.
[DIAGRAM: asset_name: Product formed and reactant remaining; asset_slug: 8462_c41_quantity_curves; caption: Product accumulates while reactant is used; both curves flatten as the reaction stops.; description: Two illustrative smooth quantity–time graphs on matching time axes from 0 to 140 seconds. The left graph shows gas produced rising from 0 to 60 cm³ by 100 seconds and then remaining constant, with the table's points. The right shows a measured reactant mass decreasing from 1.0 g to 0.4 g over the same time and then remaining constant. These are separate measured quantities, not directly subtractable units.]
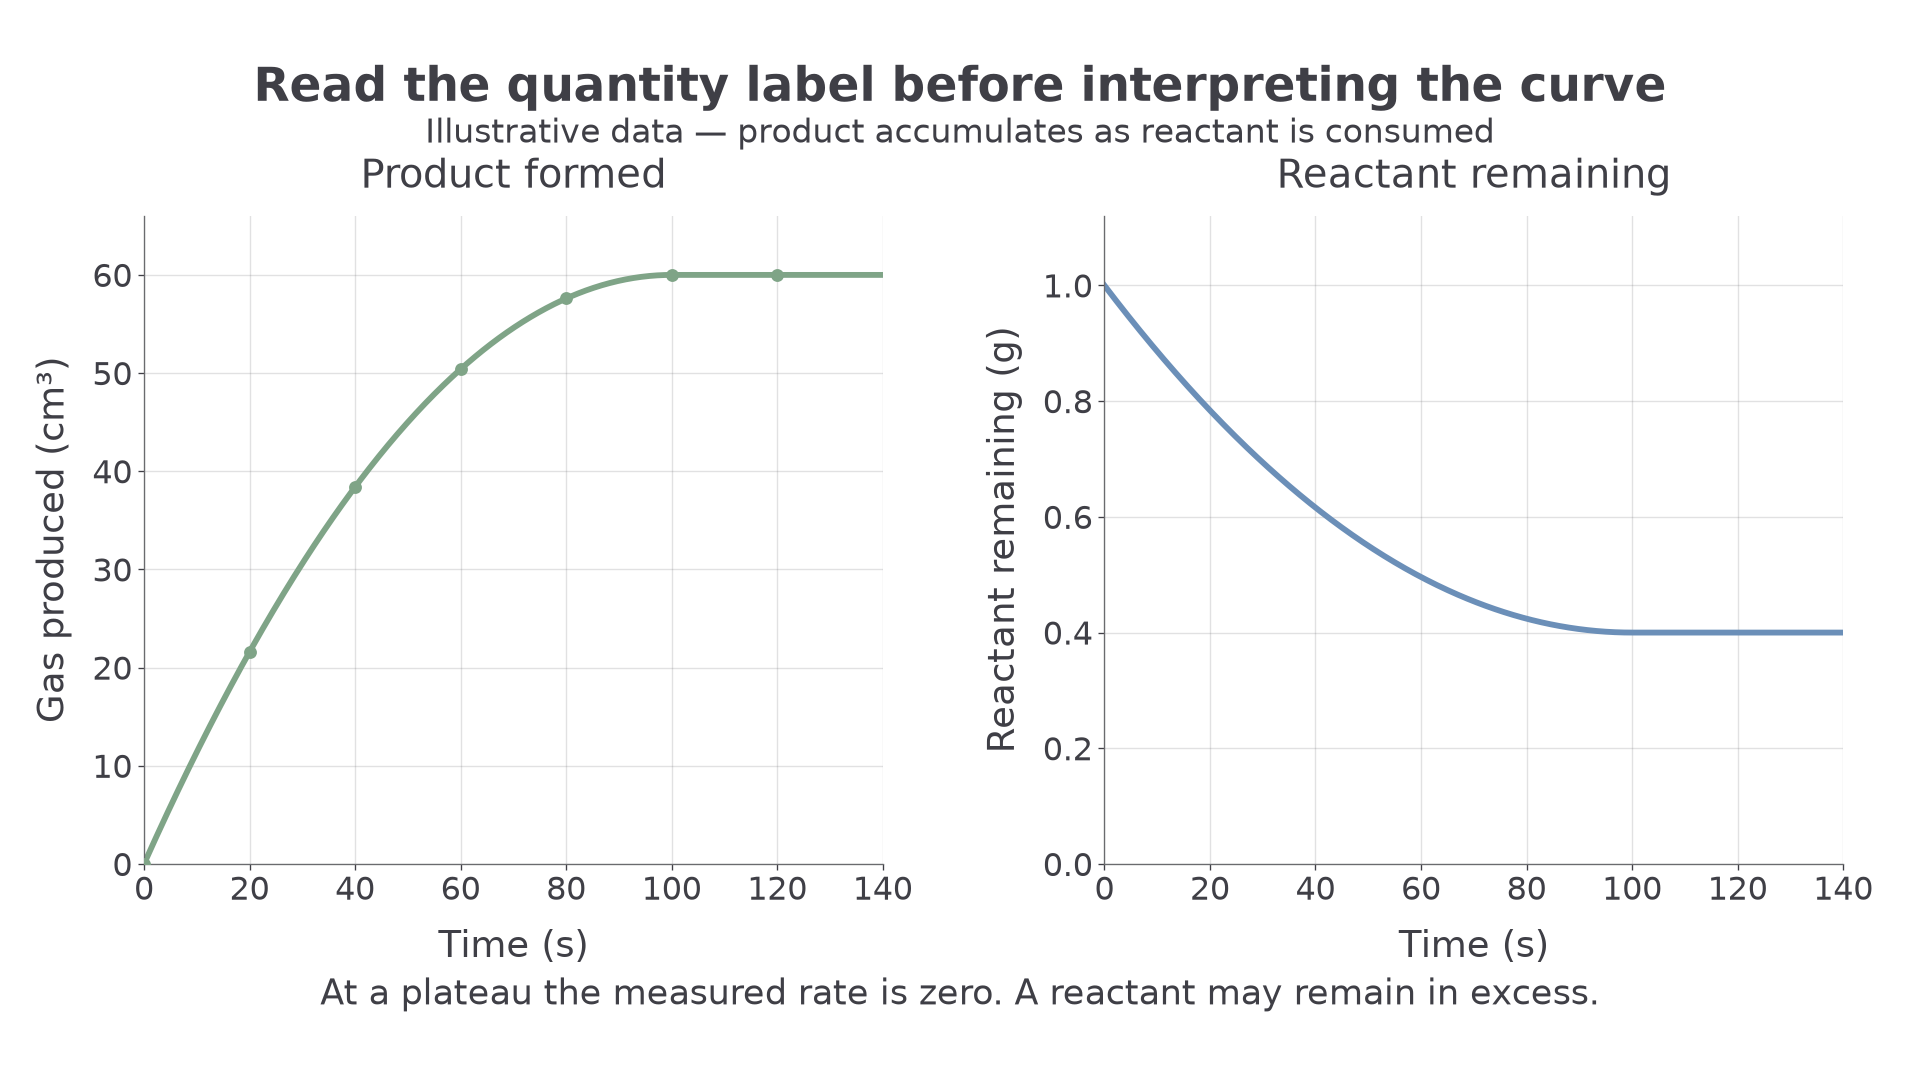
A graph of reactant used up also rises from zero because cumulative consumption increases. A graph of reactant remaining falls instead. A mass-of-apparatus graph falls when product gas escapes, whereas a mass-of-gas-produced graph rises. Read the axis label before deciding what a rising or falling curve means.
Flattening indicates no further measured chemical change. A reactant may have been used up, leaving another reactant in excess, so a remaining-reactant curve need not reach zero. Equal final gas volumes in two runs, under the same collection conditions, indicate equal final amounts of that gaseous product. A steeper curve reaching the same plateau sooner indicates a faster reaction producing the same final amount.
Optional notebook construction — ungraded. Plot the gas-volume table, label both axes and draw the smooth curve. Check the coordinate , the falling steepness, and the horizontal plateau after against the left panel.
Slopes, tangents and reaction speed
The slope of a quantity–time curve measures how quickly that quantity is changing at a particular stage.
A steep upward product curve indicates rapid product formation. A steep downward remaining-reactant curve indicates rapid reactant consumption. Compare the magnitude of the slopes for speed: a downward slope has a negative sign, but reactant-use rate is normally reported as a positive quantity. A horizontal curve has zero slope and no further measured change.
Continue this lesson.
You’re previewing NovaLearn without an account. Create a free account to read the rest.
Create free account