96 - Atomic Line Spectra
A line spectrum is a clue that an atom is not allowed to have just any energy. It can change only between particular energy levels, so the radiation it emits or absorbs has particular energies and therefore particular frequencies. This lesson is about using that idea carefully enough to explain the pattern and calculate the frequency of a line.
Separate Lines, Separate Energies
Imagine looking at a glowing low-pressure gas through a spectroscope. A filament lamp would give a broad spread of colours, but the gas gives separated bright lines on a dark background. The spectroscope is only sorting the radiation by frequency; it is not creating the pattern. The pattern comes from the atoms.
Energy level
One of the discrete (allowed) energies that an electron in an atom can have; the lowest is the ground state.
The useful model is:
- an atom has discrete energy levels
- the atom can move from one allowed level to another
- the energy change is carried by emitted or absorbed electromagnetic radiation
- because only certain energy changes are possible, only certain radiation frequencies appear
That is why a line spectrum is often called a fingerprint of an element. Different atoms have different sets of allowed energy gaps, so they produce different sets of lines.
The common wrong idea is that a hot atom can emit any colour if it is given enough energy. The correct model is more restrictive: extra energy can excite atoms, but the emitted frequencies still come from the allowed gaps between energy levels.
For an Edexcel explain question, do not stop at "energy levels are discrete". Link the full chain:
Discrete energy levels → fixed energy gaps → each photon's energy equals one gap → only certain frequencies → separate spectral lines.
Energy-Level Bookkeeping
An energy-level table is a compact way to show which energies an atom can have. The actual height of a level matters less than the gap between two levels, because the radiation energy comes from the change in atomic energy.
[DIAGRAM: asset_name: atomic energy levels; asset_slug: 9ph0_atomic_levels; recommended_method: matplotlib; description: Energy levels drawn to scale at −5.70, −3.40 and −1.50 eV; correctly directed emission and absorption arrows with positive gap values.]
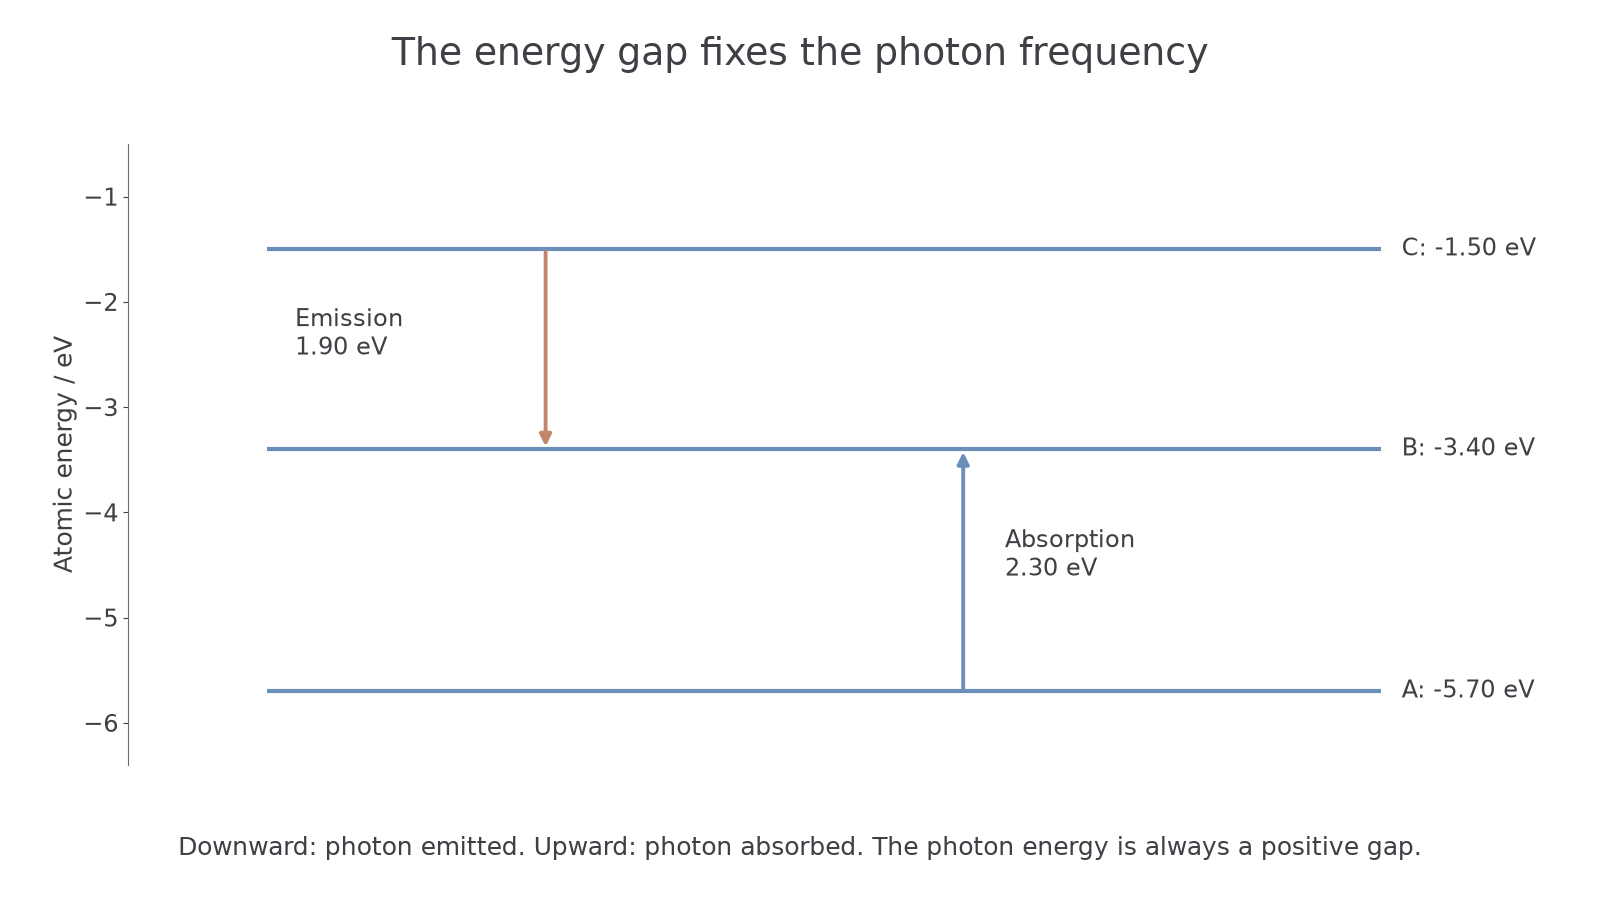
Consider this simplified atom:
| Level | Energy / eV | Position in the atom's energy ladder |
|---|---|---|
| C | higher excited level | |
| B | lower excited level | |
| A | ground level |
The negative signs can feel odd at first. In many energy-level diagrams, zero is chosen as the energy of a free electron far from the atom. Bound levels are below that zero, so they are negative. The higher level is the larger number, not the one with the larger magnitude. So is higher than .
For emission, the atom moves down to a lower energy level. The atom loses energy, and radiation carries that energy away:
For absorption, the atom moves up to a higher energy level. The atom gains energy from incoming radiation:
Both radiation energies are positive. A negative frequency is not physical; a negative value in the subtraction usually means the transition direction has been handled the wrong way round.
Two transitions using the table:
- C to B is emission: the atom moves from down to , so the radiation energy is .
- A to B is absorption: the atom moves from up to , so the absorbed energy is .
The same energy gap can be used in either direction. Downward transition: emission. Upward transition: absorption.
To list possible emission lines, list every allowed downward transition, not only neighbouring levels. For three levels A, B and C, the possibilities are C→B, B→A and C→A. With four populated levels there are at most downward pairs. This gives six distinct lines only if all those transitions are allowed and their energy gaps are different. A cascade C→B→A emits two photons whose energies add to the C→A gap; it does not emit one photon with the average energy.
Frequency From Emission
Once the radiation energy is known, the frequency comes from the photon model relationship:
Frequency of a transition
: energy gap between the two levels (J); ; : frequency of the emitted or absorbed radiation (Hz). Convert eV to J first: .
The decision point is the unit of energy. Edexcel supplies in J s, so the energy used in must be in joules. If the energy levels are given in electronvolts, use:
Worked example:
An atom moves from level C to level B in the table from the previous part. Calculate the frequency of the emitted radiation.
Step 1: choose the transition direction.
C is and B is . The atom moves down, so this is emission.
Step 2: find the positive energy carried by the radiation.
Step 3: convert to joules.
Step 4: use .
The answer is a frequency, so the unit is Hz, not J. The energy gap sets the frequency; a larger gap gives a larger frequency.
A common calculation error is to use directly in . That would mix eV with J s, giving a frequency too large by a factor of about .
Continue this lesson.
You’re previewing NovaLearn without an account. Create a free account to read the rest.
Create free account